Arrow Connected Step Diagram – Visualizing Step-by-Step Processes
RJ0600058_14
- Last Update 07/06/2025
- File Size 1.7MB
- # of Slides 2
- File Format PPTX
- Slide Ratio 16:9
- Color
Keywords
About the Product
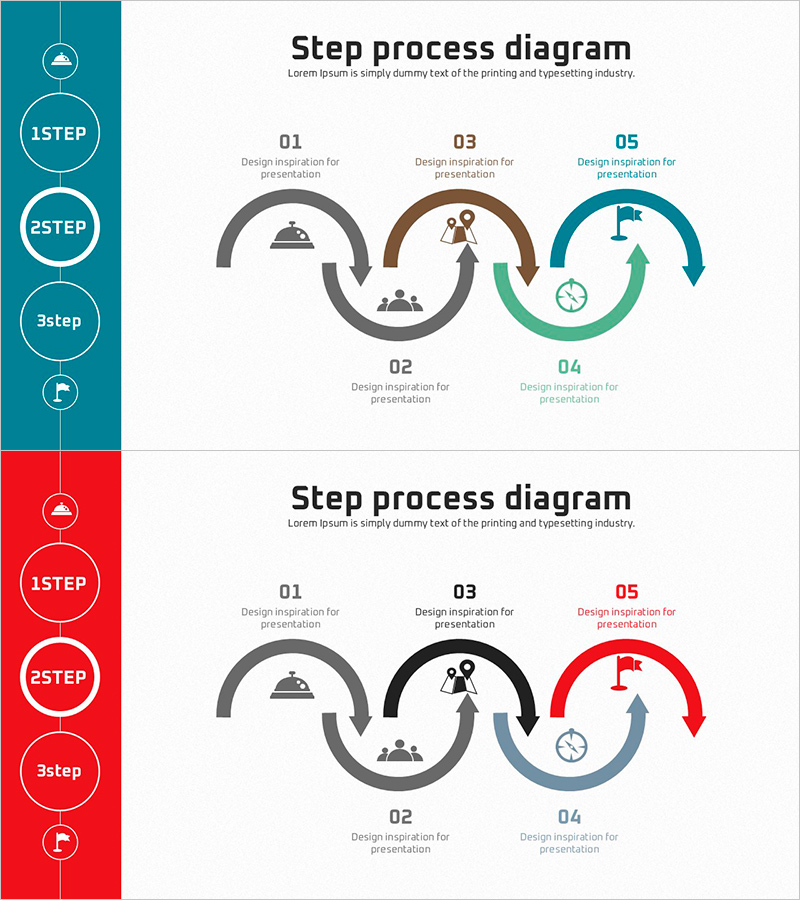
A circular process diagram PowerPoint slide with 5 interconnected steps connected by directional arrows. Each step features an icon and text area to visualize workflow, project phases, service processes, and operational cycles. The left sidebar displays step numbers to highlight current progress, and two color versions (teal and red) are included for flexible presentation styling. This 16:9 widescreen 2-slide set is fully editable and ready to use immediately.
Usage Points
-
Main Usage
Ideal for explaining project phases, business workflows, service delivery cycles, product development stages, marketing campaign timelines, and operational processes that follow a circular or sequential pattern.
-
How to Use
Enter step names and descriptions in the text boxes, and customize icons to match your workflow. Use the left sidebar numbers to emphasize the current step, and select either the teal or red color version based on your presentation theme.
-
Recommended For
Project managers, marketing professionals, operations teams, business consultants, trainers, and anyone presenting step-by-step processes. Suitable for business plans, proposals, operational plans, and training materials.
-
Slide Structure
Five circular nodes connected by directional arrows in a continuous flow. Each node contains an icon, numbered label (01–05), and description text area. A vertical sidebar on the left displays step indicators (1STEP–3step). Available in two color schemes: teal and red.
Related Products
-

Sales & Investment Plan Slide Template
#Operational Plan #Financial Plans and Performance #Diagram
-

4 Options Text Box Slide – Operation Plans and Business Support
#Operational Plan #Technical Approach #Diagram
-

PowerPoint Template for Service Operation Strategy Presentation
#Business Management #Operational Plan #Technical Approach
-

Composing a Propulsion Plan Slide – Clear Goals and Vision
#Business Management #Diagram #Implementation Plan
