Doughnut Chart Slide for Vehicle Demand Analysis
RJ0800052_14
- Last Update 08/15/2025
- File Size 0.7MB
- # of Slides 2
- File Format PPTX
- Slide Ratio 16:9
- Color
Keywords
- #Content-Based Slides
- #Design-Based Slides
- #Business Vision and Strategy
- #Technical Approach
- #Diagram
- #Graph
- #Business Goals
- #Innovative Technologies and Future Plans
- #Spread
- #Circles
- #Decentralized Diagram
- #Doughnut Chart
- #16:9
- #doughnut chart PowerPoint slide
- #pie chart template vehicle analysis
- #data visualization slide
- #3-segment donut chart
- #circular chart presentation
About the Product
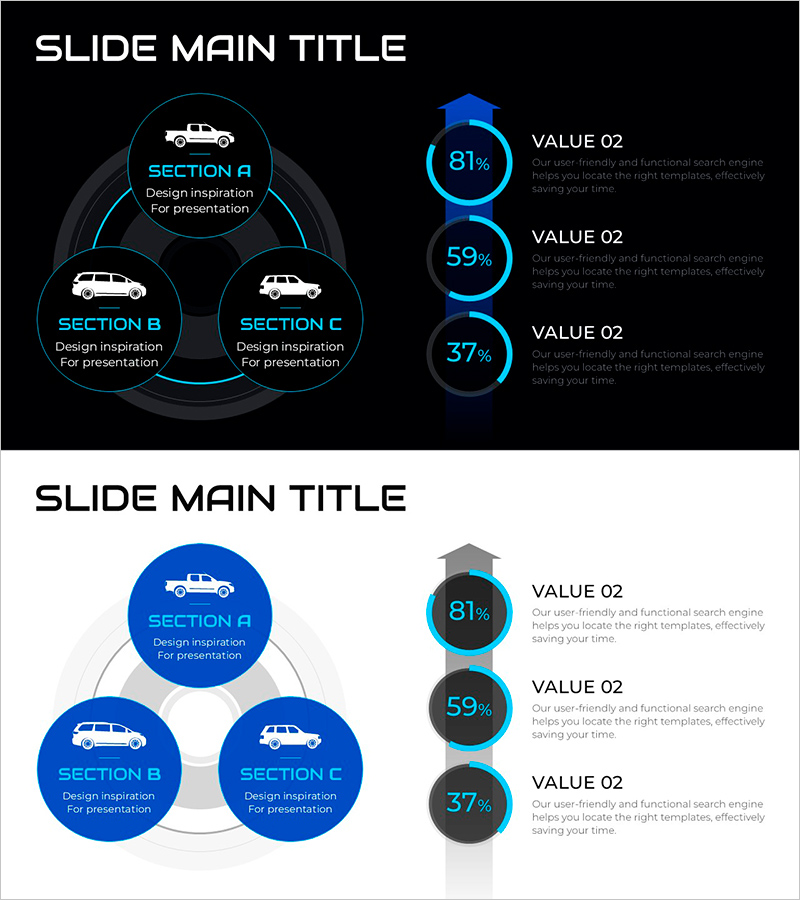
A professional doughnut chart PowerPoint slide designed for vehicle market analysis and demand assessment. The slide features a dark blue background with bright cyan circular chart segments representing vehicle category proportions. Three circular gauge indicators on the right display key metrics (81%, 59%, 37%) for immediate presentation use. The 2-slide set includes both dark and light background versions, compatible with 16:9 widescreen format. Each segment is fully editable, allowing you to input your own vehicle demand data, market share figures, or customer preference metrics.
Usage Points
-
Main Usage
Visualize vehicle market proportions, demand distribution, sales performance, and market segmentation data using circular chart format. The doughnut shape's center space accommodates additional titles or key figures, enhancing information hierarchy and audience comprehension.
-
How to Use
Edit the doughnut chart segments and percentage values to match your vehicle demand dataset. Customize the three gauge indicators on the right to represent additional metrics such as market share, growth rate, or customer satisfaction scores. Apply to sales reports, market research presentations, and strategic planning documents.
-
Recommended For
Automotive industry analysts, marketing professionals, sales strategy teams, market research report writers, and business executives preparing demand analysis presentations. Ideal for vehicle sales forecasting, market performance reviews, and competitive positioning discussions.
-
Slide Structure
Two-slide layout with dark blue background version featuring 3-segment doughnut chart and three circular gauges (81%, 59%, 37%) positioned on the right. Second slide provides light background alternative with identical chart structure in white tones, enabling flexible integration with various slide backgrounds and print-friendly output.
Related Products
-

Key Elements Explained Through 3D Frames
#Business Vision and Strategy #Diagram #Business Goals
-

3-Key Expansion Diagram - Emphasizing Business Vision and Strategy
#Business Vision and Strategy #Diagram #Business Strategy
-

Key Focus Areas for Service Delivery – Effective Business Objectives Presentation
#Business Vision and Strategy #Diagram #Business Strategy
-

Visualizing Innovative Technology and Future Plans with Triangle Diffusion Diagram
#Technical Approach #Diagram #Innovative Technologies and Future Plans
