Male and Female Analysis Results – Providing Differentiated Insights
RJ0600058_12
- Last Update 07/06/2025
- File Size 1.7MB
- # of Slides 2
- File Format PPTX
- Slide Ratio 16:9
- Color
Keywords
About the Product
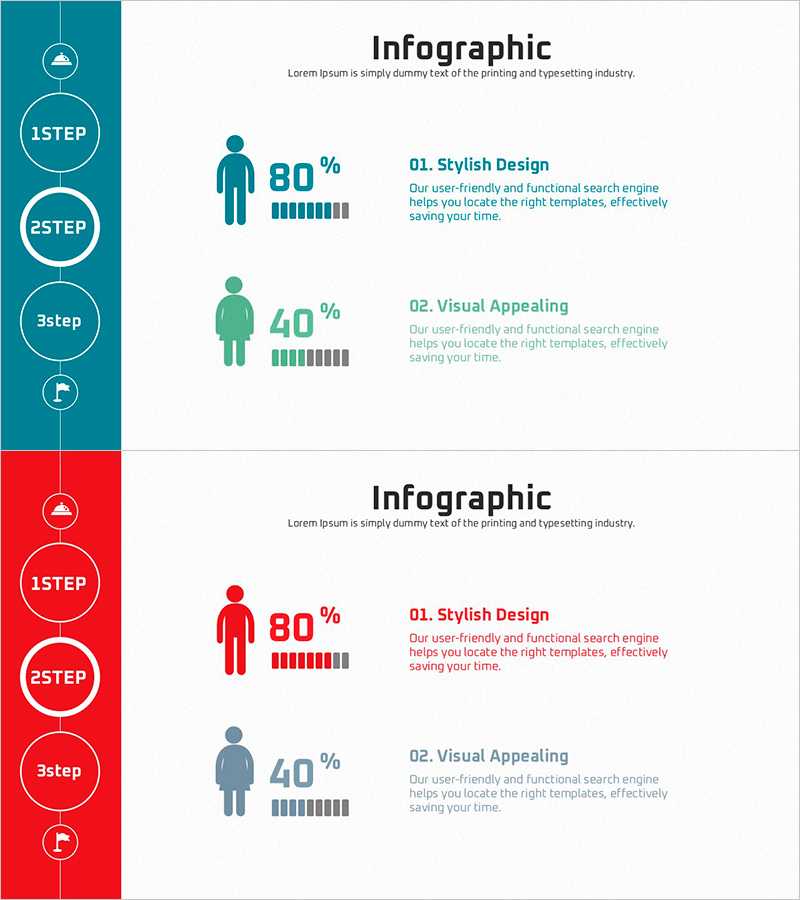
A PowerPoint slide designed for customer analysis and market segmentation, visualizing gender-based analysis results with a dual-color comparison layout. The left section features teal blue while the right section uses red, enabling side-by-side comparison of male and female customer characteristics. Each section includes human icons, percentage values, and progress bars to represent quantitative data, with a timeline-style progression indicator on the left sidebar showing sequential steps. This 2-slide set is ready to use for customer demographic analysis, market research presentations, and business reports, adding professional credibility to your analysis deck.
Usage Points
-
Main Usage
This slide presents gender-based customer characteristics and preference differences in quantitative format for segmentation analysis. It supports marketing strategy development, target audience definition, and market research presentations by visually distinguishing male and female customer purchase patterns, satisfaction levels, and perceptions to inform business decisions.
-
How to Use
Add analysis stages (1STEP, 2STEP, 3STEP) to the left timeline sidebar, then input gender labels above the human icons in each section. Replace percentage values and progress bars with actual survey data, and write insights in the right-side description text area to complete the slide.
-
Recommended For
Ideal for marketing team customer analysis presentations, executive reports, market research findings, product development team target audience definition, and sales strategy meetings. Particularly effective for gender-based customer segmentation, gender preference comparison, and gender-based purchasing power analysis scenarios.
-
Slide Structure
Two-slide set with each slide featuring a left sidebar (teal or red) with timeline and step indicators, center section with human icons, percentage values, and progress bars, and right section with title and description text. Top area includes 'Infographic' title and subtitle input fields, providing four data entry points total (two sections × two items per slide).
Related Products
-

Collaboration Silhouette Diagram – Visual Tool for Customer Analysis
#Market and Competitor Analysis #Graph #Other
-

Gender Analysis Graph – Stylish Slide for Customer Analysis
#Market and Competitor Analysis #Marketing Plan and Strategy #Graph
-

Customer Analysis Silhouette Graph – Providing Market Insights
#Market and Competitor Analysis #Graph #Other
-

Old Man Silhouette Donut Circle Graph – Customer Analysis
#Market and Competitor Analysis #Graph #Other
