Old Man Silhouette Donut Circle Graph – Customer Analysis
RJ0400032_17
- Last Update 05/26/2025
- File Size 8.1MB
- # of Slides 2
- File Format PPTX
- Slide Ratio 16:9
- Color
Keywords
About the Product
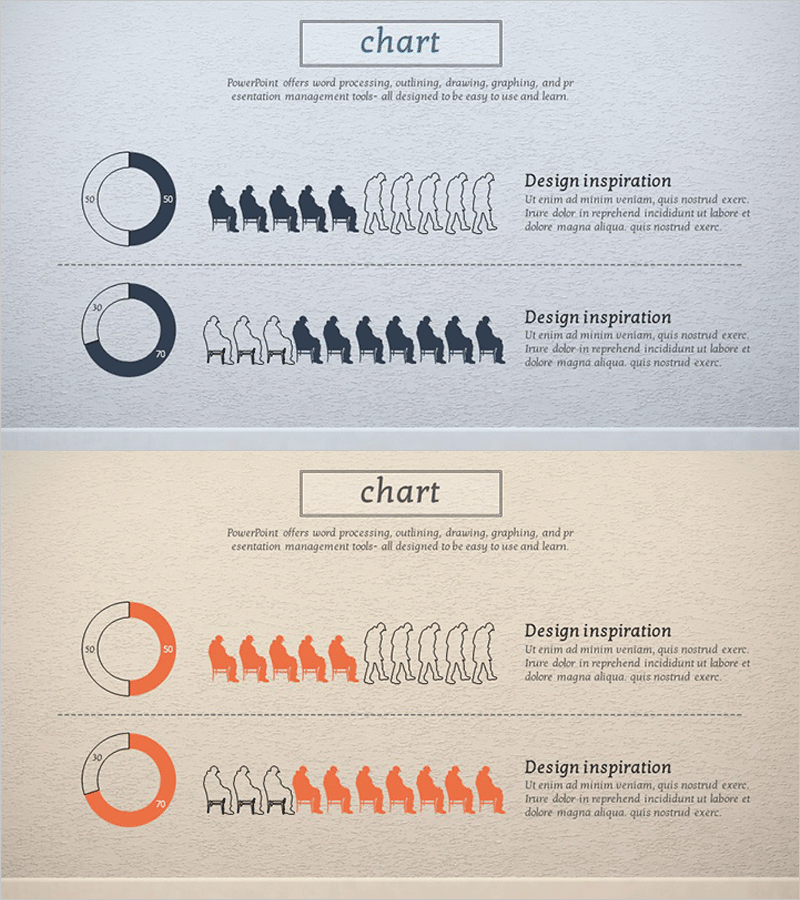
A professional donut chart PowerPoint slide optimized for customer analysis and market segmentation presentations. This template combines donut-shaped pie charts with elderly silhouette icons in a minimalist gray and black color scheme to emphasize data credibility. Each slide integrates proportional data visualization with demographic icons, making it ideal for customer segmentation analysis, age-group comparisons, population statistics, and generational breakdowns. The 16:9 widescreen format includes 2 slides that seamlessly integrate into presentation flows, allowing immediate use in business reports and analytical decks.
Usage Points
-
Main Usage
Visualizes two-level customer composition, demographic breakdowns, and age-group proportions through donut-shaped pie charts. Elderly silhouette icons provide intuitive context for senior customer analysis, generational comparisons, and population structure presentations.
-
How to Use
Double-click the donut chart to edit data values and customize labels according to your presentation context. The gray background with black silhouettes ensures clear visibility in projector and online presentation environments without requiring additional formatting.
-
Recommended For
Marketing teams conducting customer segmentation analysis, HR departments presenting demographic reports, academic presentations in sociology and statistics, government and public sector population policy briefings, and healthcare/social welfare institutions analyzing elderly demographics. Particularly effective for business reports requiring age-group ratio comparisons.
-
Slide Structure
Two-slide layout with each slide featuring one donut chart paired with 5-10 elderly silhouette icons arranged horizontally. First slide displays 5 silhouettes, second slide shows 10 silhouettes, enabling flexible representation of different data scales and proportions.
Related Products
-

Customer Share Analysis Chart – Insights for Successful Business
#Market and Competitor Analysis #Graph #Other
-

Shopping Mall User Gender Ratio Analysis Chart
#Market and Competitor Analysis #Graph #Other
-

Soccer Game Illustration Graph for Market and Competitive Analysis
#Business Strategy #Market and Competitor Analysis #Graph
-

User Analysis Donut Chart – Optimal for Market and Competitor Analysis
#Market and Competitor Analysis #Graph #Other
