Adventure Business Line Graph Slide for Market Research
RJ0600055_6
- Last Update 07/05/2025
- File Size 4.5MB
- # of Slides 2
- File Format PPTX
- Slide Ratio 16:9
- Color
Keywords
About the Product
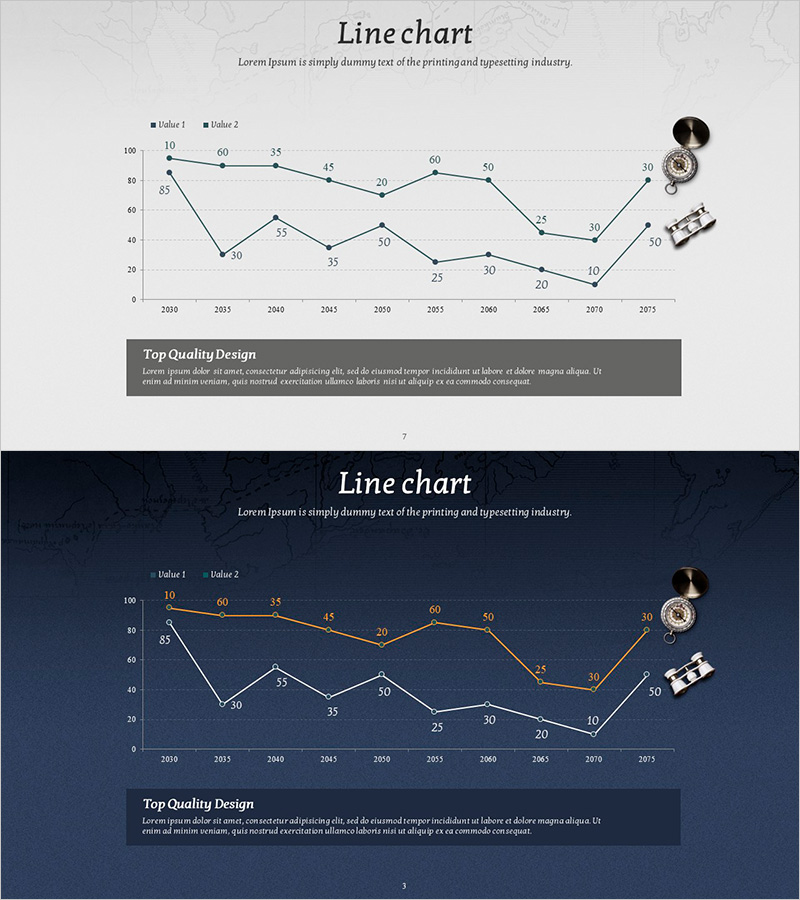
A dual-series line chart PowerPoint slide designed for market research and competitive analysis presentations. This template visualizes long-term data trends from 2019 to 2075, displaying two independent data series (Label 1 and Label 2) with clear visual distinction. The light gray background features a black grid with orange and blue line colors for strong contrast, making it ideal for presenting business performance metrics, market share fluctuations, and competitive benchmarks. Supplied in 16:9 widescreen format with 2 fully editable PPTX slides, ready for immediate integration into reports, proposals, and strategic presentations.
Usage Points
-
Main Usage
Optimized for visualizing market research, competitive analysis, and business performance trends across extended time periods. The dual-series format enables direct comparison of two independent metrics, revealing relative changes and patterns over 10+ years at a glance, essential for strategic decision-making.
-
How to Use
Double-click data points and labels within the chart to replace them with your actual figures. Edit legend text, axis labels, and slide titles using standard text boxes. Customize line colors and marker styles via PowerPoint's built-in chart tools. Adjust the design to match your corporate brand colors before inserting into presentations.
-
Recommended For
Ideal for executives, marketing teams, sales departments, and strategic planning units presenting quarterly or annual performance reports, market share evolution, and competitive benchmarking. Suitable for investor presentations, business plans, marketing strategies, consulting reports, and data-driven decision documents.
-
Slide Structure
Two-slide set: Slide 1 features a light gray background with standard dual-series line chart (2 data series, 10 data points, legend, gridlines, and numeric labels). Slide 2 presents the identical chart structure on a dark navy background for dark-theme presentations. Both slides include a 'Top Quality Design' text box at the bottom for additional commentary.
Related Products
-

Blue Yellow Line Graph – Market and Competitive Analysis
#Market and Competitor Analysis #Graph #Market Analysis
-

Market Trend Analysis of Traditional Tea – Market Share Changes
#Market and Competitor Analysis #Graph #Market Analysis
-

Line Chart for Performance Variation Visualization – The Basics of Presentation
#Market and Competitor Analysis #Graph #Market Analysis
-

Graph of Industrial Change and Global Market Analysis – Understanding Market Trends
#Market and Competitor Analysis #Diagram #Graph
