Eco-friendly Business Future Outlook Line Graph – Market Analysis
RJ0600051_17
- Last Update 07/04/2025
- File Size 8MB
- # of Slides 2
- File Format PPTX
- Slide Ratio 16:9
- Color
Keywords
About the Product
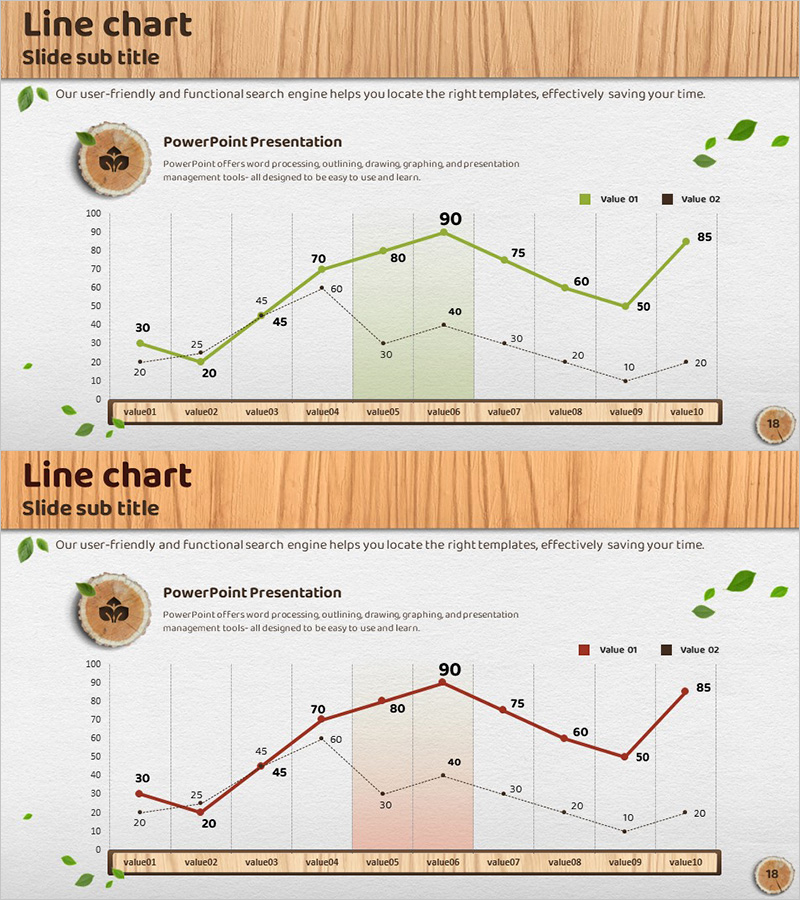
A 2-slide line chart PowerPoint presentation visualizing eco-friendly business future outlook and market trends. Dual data series in green and red colors enable simultaneous comparison of Value 01 and Value 02 across 10 data points (value01 through value10). The chart clearly displays rising, falling, and fluctuating patterns with shaded background areas highlighting critical periods. Wood-tone header and natural leaf decorative elements reinforce eco-friendly brand identity. Ready for immediate use in business presentations, quarterly reports, market analysis documents, and competitive benchmarking slides.
Usage Points
-
Main Usage
Ideal for comparing and analyzing two or more data series over time. Effectively communicates numerical insights about market size, revenue, customer satisfaction, or growth metrics to executives, investors, and stakeholders in eco-friendly and sustainability sectors.
-
How to Use
Replace data points and legend labels with your actual figures. Use green series for positive indicators (growth, increase) and red series for comparison targets (competitors, previous periods), or customize colors as needed. Leverage shaded background areas to emphasize critical time periods and draw audience attention to key insights.
-
Recommended For
Perfect for business plans, investment pitch decks, quarterly earnings reports, market analysis presentations, and competitive benchmarking. Recommended for sustainability-focused companies, environmental consultants, and business strategists presenting growth strategies, revenue trends, and market share evolution.
-
Slide Structure
2-slide deck. Slide 1 emphasizes green series (Value 01), Slide 2 emphasizes red series (Value 02). Each displays 10 data points on Y-axis (0–100 range) and X-axis (value01–value10 labels). Features shaded background area (value05–value06 region), legend, wood-tone header, and natural leaf icons.
Related Products
-

Divorce Count Graph – Future Trends Analysis
#Market and Competitor Analysis #Graph #Future Outlook
-

Commuting Public Transportation Status Graph – Market Analysis and Outlook
#Market and Competitor Analysis #Graph #Future Outlook
-

Current Status Graph Analysis and Forecast – Market and Competitor Analysis
#Market and Competitor Analysis #Graph #Future Outlook
-

Line Graph Market Research by Year – Market Trend Analysis
#Market and Competitor Analysis #Graph #Future Outlook
