Energy Saving Practice Rate Survey Pie Chart
RJ0600050_4
- Last Update 07/04/2025
- File Size 0.2MB
- # of Slides 2
- File Format PPTX
- Slide Ratio 16:9
- Color
Keywords
About the Product
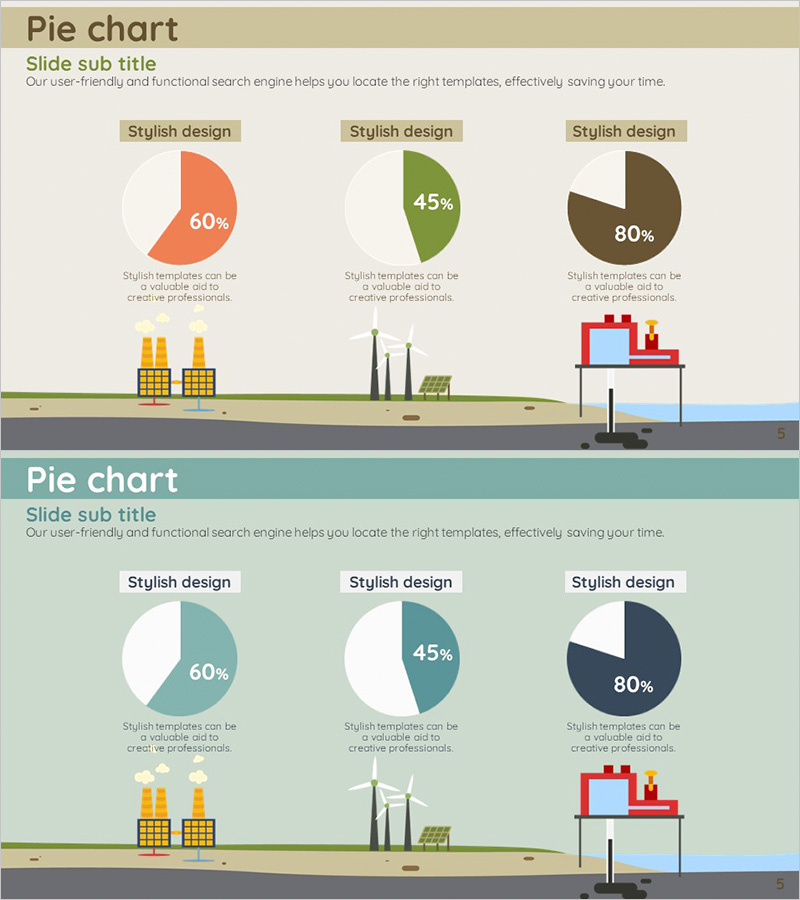
A PowerPoint slide deck featuring three pie charts designed to visualize energy saving practice rate survey data. The charts display proportions of 60%, 45%, and 80% in orange, green, and brown color schemes respectively, with industry-related icons positioned at the bottom of each chart. The 2-slide set includes two color themes: a beige background version and a teal background version, allowing you to select the design that best matches your presentation context and document tone. Ready-to-use slides for market analysis and comparative data visualization sections.
Usage Points
-
Main Usage
Visualize ratio-based data such as energy saving practice rates, market share percentages, and customer satisfaction scores using pie chart format for immediate comparison analysis. Three independent pie charts enable simultaneous visualization of multiple data sets, making it ideal for presentations requiring multi-item comparative analysis.
-
How to Use
Use in business strategy presentations, market analysis reports, energy policy briefings, environmental seminars, and sustainability initiatives to communicate survey results clearly to audiences. Customize the text area below each pie chart with item labels and interpretations to strengthen data context and narrative.
-
Recommended For
Energy management professionals, environmental policy planners, market research analysts, business development teams, marketing strategists, educators, and sustainability consultants presenting survey results and statistical data.
-
Slide Structure
2-slide set with 3 pie charts per slide. Each chart is divided into 2 segments (primary ratio + remainder) with a 'Stylish design' label at the top, percentage values in the center, descriptive text and industry icons at the bottom. Available in beige and teal background themes.
Related Products
-

Camping Business Competitor Analysis Pie Chart
#Business Strategy #Market and Competitor Analysis #Graph
-

Sea Life Pi Type Chart – Market Share Analysis
#Business Strategy #Market and Competitor Analysis #Graph
-

Yellow Marketing Pie Chart – Market Share Analysis
#Market and Competitor Analysis #Graph #Market Status
-

Share Analysis of Two Topics with Pie Chart
#Market and Competitor Analysis #Diagram #Graph
