Camping Business Competitor Analysis Pie Chart
RJ0600031_24
- Last Update 06/29/2025
- File Size 1.5MB
- # of Slides 2
- File Format PPTX
- Slide Ratio 16:9
- Color
Keywords
- #Content-Based Slides
- #Design-Based Slides
- #Business Strategy
- #Market and Competitor Analysis
- #Graph
- #Achievements
- #Market Share
- #Circles
- #Pie Chart
- #16:9
- #pie chart PowerPoint slide
- #circular chart template
- #ratio comparison slide
- #market share pie chart
- #competitor analysis chart
- #pie graph PowerPoint download
About the Product
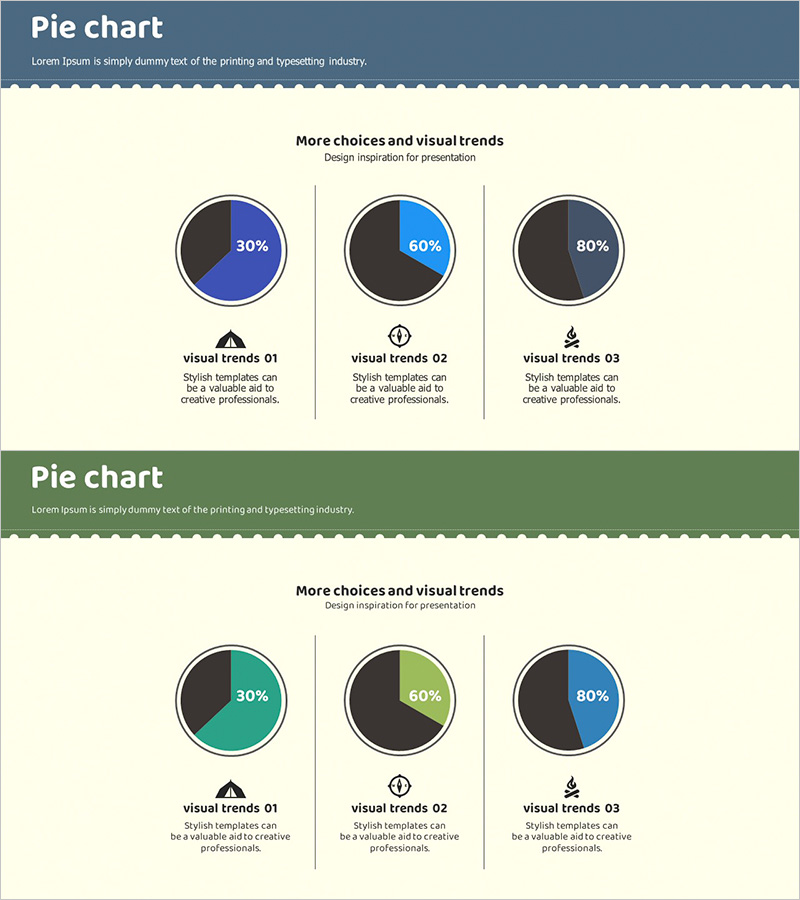
A professional pie chart PowerPoint slide set optimized for competitor analysis and market share comparison. Featuring a dark gray background with blue, turquoise, and lime-colored 3-segment pie charts, each section displays percentage values alongside icons and descriptive text. Available in 16:9 widescreen PPTX format for immediate editing. Perfect for business analysis presentations, marketing reports, performance reviews, and strategic planning decks where visual data representation is essential.
Usage Points
-
Main Usage
Designed to visually represent three or more data categories as percentages, making it ideal for competitor analysis, market share distribution, and business performance metrics. Each segment can accommodate numerical values, legends, and descriptive labels to enhance audience comprehension.
-
How to Use
Edit chart colors, percentages, and labels directly in the slide master to match your specific data. Insert into executive reports, marketing strategy presentations, or business analysis decks to effectively communicate data-driven insights during your presentation.
-
Recommended For
Recommended for executives, marketing managers, business analysts, consultants, and educators who require data-driven presentations. Applicable across industries including camping, tourism, retail, finance, and manufacturing for competitive analysis and market positioning discussions.
-
Slide Structure
Two-slide set with one 3-segment pie chart per slide. Each chart features percentage values in the center, with icon and text description areas below, allowing simultaneous representation of up to three data categories with clear visual hierarchy.
Related Products
-

Energy Saving Practice Rate Survey Pie Chart
#Business Strategy #Market and Competitor Analysis #Graph
-

Sea Life Pi Type Chart – Market Share Analysis
#Business Strategy #Market and Competitor Analysis #Graph
-

Yellow Marketing Pie Chart – Market Share Analysis
#Market and Competitor Analysis #Graph #Market Status
-

3D Pie Chart Analysis (Green & Blue) – Market Share Visualization
#Market and Competitor Analysis #Graph #Market Status
