Target Market Strategy for Energy Saving Slide
RJ0600050_19
- Last Update 07/04/2025
- File Size 0.3MB
- # of Slides 2
- File Format PPTX
- Slide Ratio 16:9
- Color
Keywords
- #Content-Based Slides
- #Design-Based Slides
- #Market and Competitor Analysis
- #Marketing Plan and Strategy
- #Graph
- #Other
- #Industry Trends
- #Target Market Strategy
- #Line
- #Line Chart
- #16:9
- #line chart PowerPoint
- #trend analysis slide template
- #4-series data visualization
- #market strategy presentation
- #marketing graph template download
About the Product
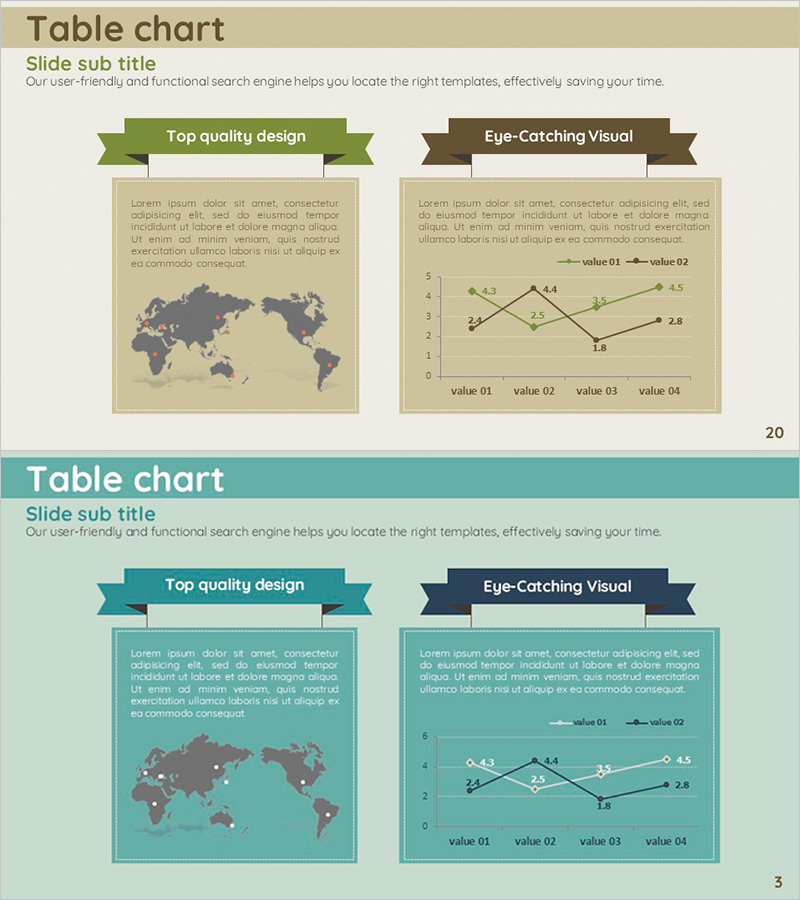
A line chart PowerPoint slide designed for target market strategy and energy-saving marketing presentations. This 2-slide set features beige and teal backgrounds with 4-series trend data visualization. Each slide includes a vertical line chart with ribbon banner titles, descriptive text areas, and world map elements for immediate use in market analysis and strategic planning presentations. Available in 16:9 widescreen PPTX format, fully editable in all PowerPoint versions.
Usage Points
-
Main Usage
Visualize time-series data such as market trends, sales performance, and growth changes across 4 different series. Ideal for presenting competitive benchmarking, measuring energy-saving policy effectiveness over time, tracking marketing campaign ROI changes, and supporting data-driven strategic decisions in market planning.
-
How to Use
Slide 1 introduces overall market context with a world map and supporting text. Slide 2 presents the vertical line chart comparing 4 regions, products, or channels with distinct color-coded series. Data points and legend ensure accurate numerical communication. Add strategic insights and analysis to the text areas to complete the narrative.
-
Recommended For
Marketing managers, strategy planning teams, sales directors, and executives. Recommended for quarterly and annual performance reviews, post-launch market response tracking, energy efficiency improvement validation, and global market expansion strategy presentations where data-driven insights are critical.
-
Slide Structure
Slide 1: Beige background, 2 ribbon banner titles, descriptive text boxes, world map graphic. Slide 2: Teal background, 2 ribbon banner titles, vertical line chart (4 series, 4 data points each), legend, axis labels (value 01–04), descriptive text boxes. Full 16:9 widescreen format, PPTX fully editable.
Related Products
-

Market Trends & Future Outlook Graph – An Intuitive Presentation Template
#Market and Competitor Analysis #Graph #Other
-

Camera and Line Chart Comparison - Market Trends and Future Outlook
#Market and Competitor Analysis #Graph #Other
-

Competitor Analysis Broken Line Graph – Visualizing Market Trends
#Market and Competitor Analysis #Graph #Other
-

Modern Business Presentation Template Line Chart
#Business Strategy #Market and Competitor Analysis #Graph
