Camera and Line Chart Comparison - Market Trends and Future Outlook
RJ0500021_23
- Last Update 06/12/2025
- File Size 0.9MB
- # of Slides 2
- File Format PPTX
- Slide Ratio 16:9
- Color
Keywords
- #Content-Based Slides
- #Design-Based Slides
- #Market and Competitor Analysis
- #Graph
- #Other
- #Future Outlook
- #Industry Trends
- #Line
- #Line Chart
- #16:9
- #line chart PowerPoint slide
- #dual-series trend comparison
- #market analysis chart template
- #competitive analysis PowerPoint
- #how to create line chart in PowerPoint
About the Product
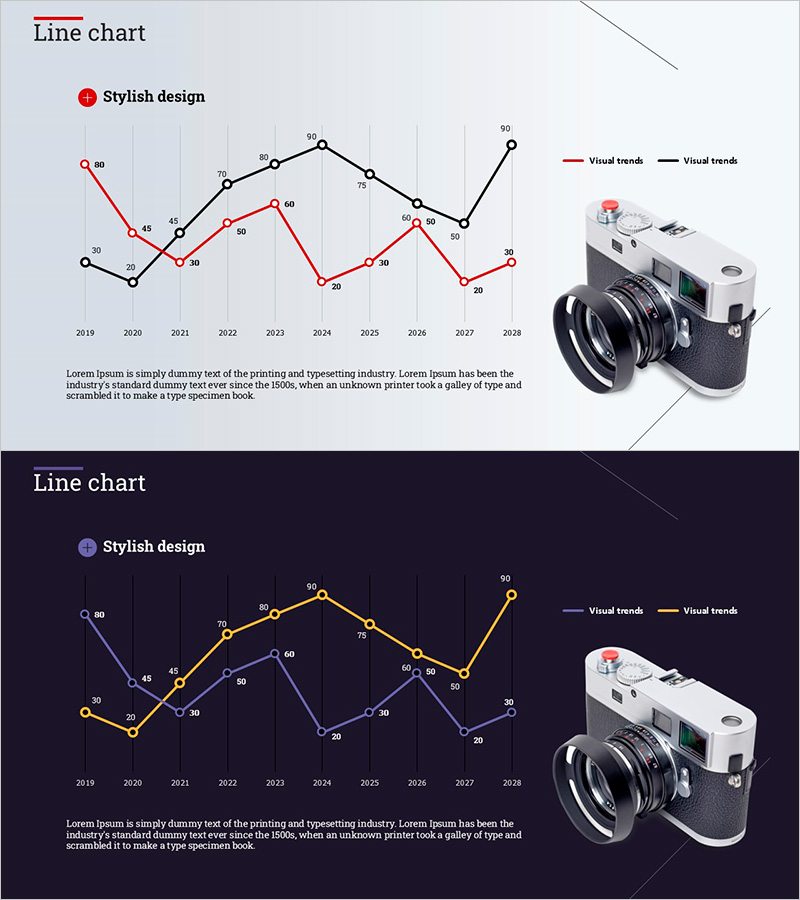
A professional PowerPoint slide featuring dual-series line charts for visualizing market trends and competitive analysis. Two design versions are provided: light background and dark background, with red and black line series clearly representing data progression from 2019 to 2028. Each data point includes numerical labels for precise information delivery. The slide incorporates a camera product image alongside the chart, making it immediately applicable for product presentations and market analysis reports. Fully editable in PPTX format with 16:9 aspect ratio.
Usage Points
-
Main Usage
Designed to compare two data series over time, effectively visualizing market trends, sales progression, and competitive performance metrics. The numerical labels on each data point ensure accurate information communication while the dual-line design enables clear side-by-side comparison of trends.
-
How to Use
Ideal for business presentations, market analysis reports, and competitive intelligence slides. The light background version suits bright conference rooms while the dark version works well in dimly lit environments. Data values are fully editable, allowing you to input actual statistics and customize the chart to your specific analysis needs.
-
Recommended For
Marketing professionals, executives, business analysts, and consultants presenting market conditions and performance metrics. Recommended for product launches, business performance reports, investor pitch decks, and strategic planning presentations where quantitative evidence is essential.
-
Slide Structure
Two-slide set featuring dual-series line charts with red and black lines centered on each slide. Includes legend, axis labels, and numerical data point markers. Camera product mockup positioned on the right side combines product introduction with data visualization. Optimized for 16:9 widescreen format and modern presentation environments.
Related Products
-

Market Trends & Future Outlook Graph – An Intuitive Presentation Template
#Market and Competitor Analysis #Graph #Other
-

Online Presentation Template Line Chart – Market Trends and Visualization
#Market and Competitor Analysis #Graph #Future Outlook
-

Market Trends and Competitor Analysis Chart – Emphasizing Future Outlook
#Market and Competitor Analysis #Graph #Future Outlook
-

Future Outlook Line Graph Blue Orange
#Market and Competitor Analysis #Graph #Other
