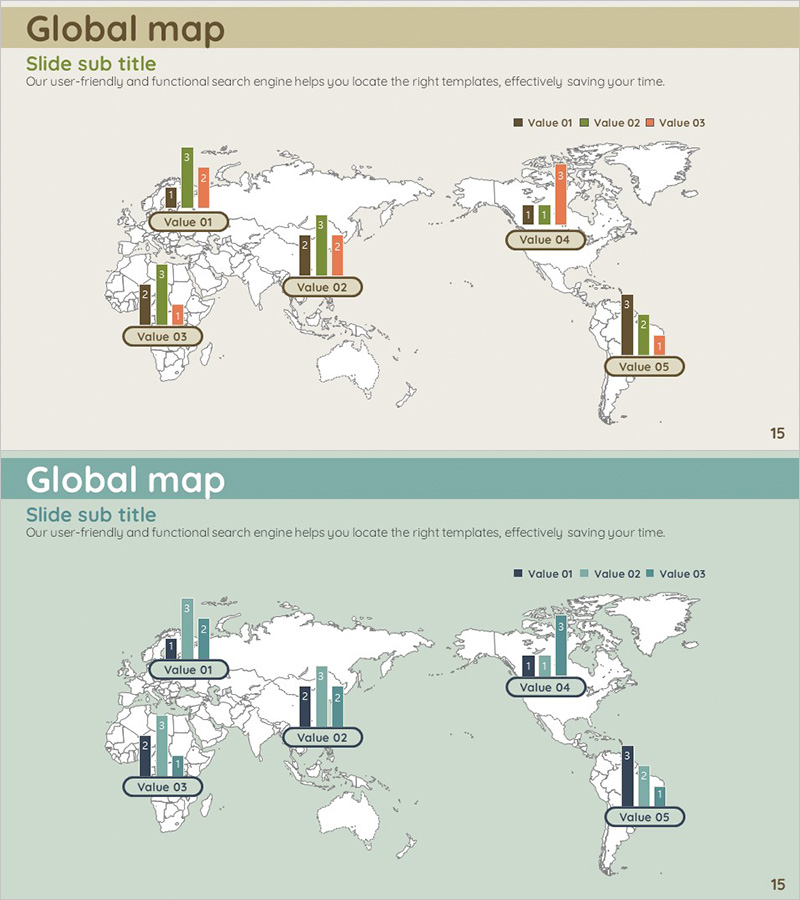
Energy Saving Practice Rate Analysis by Country – Horizontal Bar Chart
RJ0600050_14
- Last Update 07/04/2025
- File Size 0.6MB
- # of Slides 2
- File Format PPTX
- Slide Ratio 16:9
- Color
Keywords
- #Content-Based Slides
- #Design-Based Slides
- #Market and Competitor Analysis
- #Corporate Social Responsibility
- #Graph
- #Other
- #Market Overview
- #Competitive Advantage
- #Environmental Protection Efforts
- #Column
- #Grouped Column
- #Map
- #16:9
- #world map PowerPoint slide
- #global data visualization
- #regional bar chart template
- #country comparison slide
- #international market analysis presentation
About the Product
A PowerPoint slide featuring a world map with bar charts displaying data across 5 global regions. Available in two color versions—beige and teal—each region shows 3 data series for comparative analysis. Ideal for presentations requiring international market analysis, regional sales performance, energy consumption comparisons, or global competitive positioning. The callout-style data labels on the map ensure clear information delivery, while all chart elements are fully editable for seamless data input and customization.
Usage Points
-
Main Usage
Designed for global market analysis, regional performance comparison, and international data visualization presentations. The world map background combined with 5 regional bar charts allows simultaneous display of geographic location and numerical data. Suitable for energy analysis, environmental reports, sales performance, market share comparisons, and international business presentations.
-
How to Use
Open the slide and replace the bar chart data with your own figures. Edit the legend labels (Value 01, 02, 03) to match your actual data categories, then adjust bar heights to reflect your values. Colors are fully customizable, and callout labels can be edited to add region names or additional information. All elements are editable in PowerPoint.
-
Recommended For
International business presentations, global marketing strategy reports, regional sales analysis, environmental and energy policy briefings, international partnership proposals, and market research presentations. Recommended for executives, marketing professionals, policy makers, consultants, and analysts presenting cross-border comparisons.
-
Slide Structure
2-slide set featuring beige and teal background versions of the world map. Each slide displays a world map with 5 labeled regions (Value 01–05), each showing 3 data series as bar charts in callout format. Provided in 16:9 widescreen format, PPTX file type, with all elements fully editable and customizable.
Related Products
-

Bundled Graphs and Maps for Business Plan Visualization
#Market and Competitor Analysis #Graph #Other
-

Sensuous Cloud Presentation Template with World Map
#Market and Competitor Analysis #Diagram #Other
-

Business Bundle Bar Graph – Market Analysis and Competitive Edge
#Market and Competitor Analysis #Graph #Competitor Analysis
-

Travel Guide Market Analysis by State in the United States Using Horizontal Bar Chart
#Market and Competitor Analysis #Graph #Other
