Watercolor Step-by-Step Schedule Planning Table – Elegant Data Representation
RJ0600049_12
- Last Update 07/03/2025
- File Size 9.4MB
- # of Slides 2
- File Format PPTX
- Slide Ratio 16:9
- Color
Keywords
- #Content-Based Slides
- #Design-Based Slides
- #Business Strategy
- #Financial Plans and Performance
- #Diagram
- #Step-by-Step Schedule Plan
- #Key Financial Indicators
- #Cluster
- #Table
- #Closed Cluster Diagram
- #Standard Table
- #16:9
- #table PowerPoint slide
- #watercolor presentation template
- #schedule planning table design
- #step-by-step data visualization
- #business table slide template
About the Product
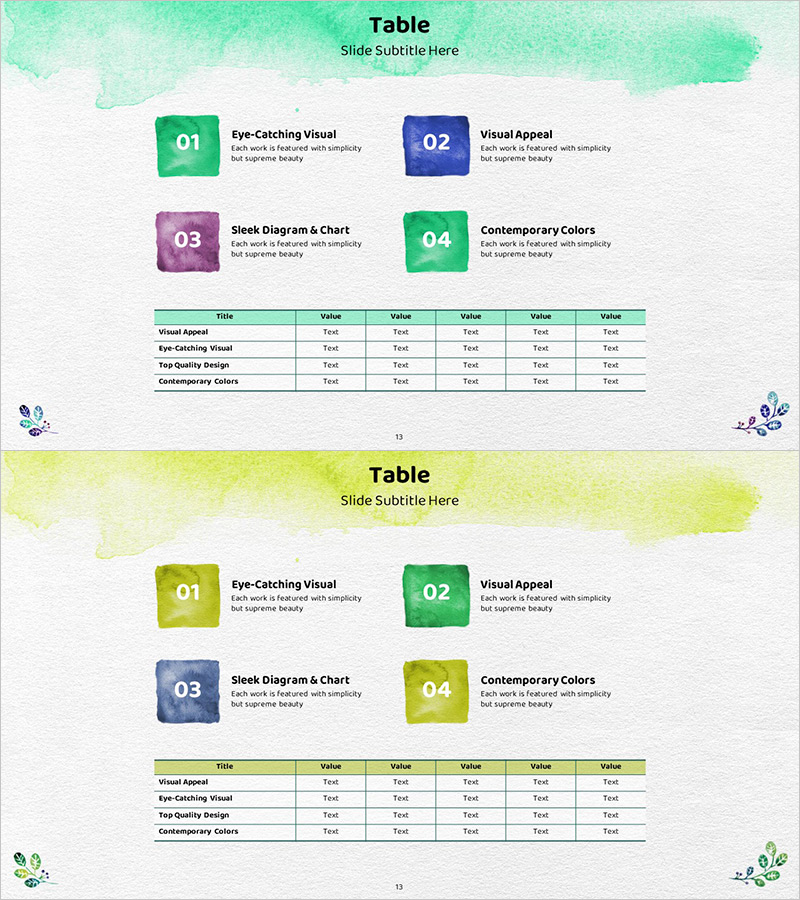
A 2-slide watercolor-themed table PowerPoint template for intuitive data representation. Features four color-coded numbered boxes (mint, purple, green, pink) and a horizontal data table structure to express step-by-step schedules, project progress, and task planning. Each slide includes a watercolor wash header and five-column information input area, perfect for business presentations, planning documents, and progress reports. Delivered in 16:9 widescreen PPTX format, fully editable and ready to use immediately.
Usage Points
-
Main Usage
Organize and present project timelines, task progress, milestones, and phase-by-phase plans through visual table layout. The watercolor background and color-coded numbered boxes emphasize data intuitively, while five-column input areas clearly express comparative, analytical, and tracking information.
-
How to Use
Enter project phases, assignees, dates, status, and outcomes into each table row. Color-coded boxes (01–04) indicate sequence order, and the watercolor header creates a soft presentation atmosphere. Use in planning documents, progress reports, and meeting materials as a data organization section.
-
Recommended For
Ideal for project managers, planning teams, marketing departments, and operations teams organizing schedules and task assignments. Suitable for business plans, marketing strategies, progress reports, proposals, and training materials requiring data visualization sections.
-
Slide Structure
2-slide set. Each slide features a watercolor wash header with four color-coded numbered boxes (01–04 in mint, purple, green, pink) and a horizontal data table below (header row + 4 data rows, 5 columns). Widescreen 16:9 format provides ample input space; PPTX format allows full customization of all elements.
Related Products
-

Income Statement Table – Clearly Presenting Financial Plans and Performance
#Financial Plans and Performance #Diagram #Income Statement
-

Key Financial Indicators Table – Essential Information Visualization
#Financial Plans and Performance #Diagram #Income Statement
-

Sales and Profit Table – Statistical Financial Performance
#Financial Plans and Performance #Diagram #Sales and Revenue
-

Analysis Table of Korean Culture – An Effective Data Visualization Tool
#Financial Plans and Performance #Diagram #Balance Sheet
