Customer Analysis Infographic Chart – Visualizing Competitive Edge
RJ0600031_11
- Last Update 06/29/2025
- File Size 1.5MB
- # of Slides 2
- File Format PPTX
- Slide Ratio 16:9
- Color
Keywords
About the Product
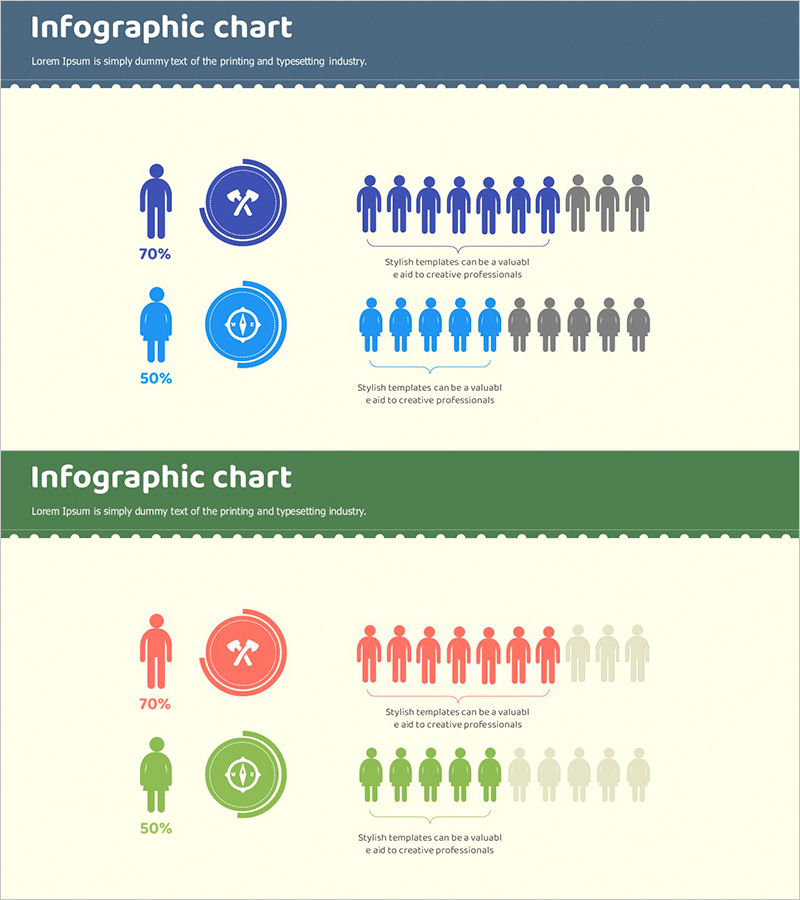
A professional infographic PowerPoint slide template for visualizing customer analysis and competitive positioning through donut charts. This presentation combines circular donut charts with human silhouette icons to display percentage data and demographic information simultaneously. The design features a cream background with blue, red, and green color schemes across two slides, each comparing two key metrics. Ideal for marketing reports, business analysis presentations, customer segmentation materials, and competitive landscape analysis.
Usage Points
-
Main Usage
Communicate customer analysis, market segmentation, and competitive advantage through visual ratio data representation. The donut chart format clearly displays part-to-whole relationships, while silhouette icons emphasize demographic and population statistics in an intuitive manner.
-
How to Use
Apply to customer analysis sections in marketing reports, market analysis pages in business plans, and competitive analysis slides in investor pitch decks. Customize the donut chart values and labels with your own data, and adjust colors to match your corporate branding guidelines.
-
Recommended For
Marketing professionals, business analysts, strategy planners, management consultants, and sales executives presenting customer insights and market data. Particularly effective for B2B reports, executive briefings, and stakeholder presentations requiring data-driven storytelling.
-
Slide Structure
Two-slide template with consistent layout. Each slide features one donut chart with circular icon on the left side and ten human silhouette figures on the right representing percentage distribution. First slide uses blue color palette; second slide employs red and green tones for visual differentiation.
Related Products
-

Soccer Game Illustration Graph for Market and Competitive Analysis
#Business Strategy #Market and Competitor Analysis #Graph
-

Natural Environment Main Target Audience Analysis Donut Chart
#Market and Competitor Analysis #Graph #Other
-

Old Man Silhouette Donut Circle Graph – Customer Analysis
#Market and Competitor Analysis #Graph #Other
-

Customer Share Analysis Chart – Insights for Successful Business
#Market and Competitor Analysis #Graph #Other
