Renewable Energy Business Market Research by Continent Horizontal Bar Chart
RJ0600048_33
- Last Update 07/03/2025
- File Size 1.8MB
- # of Slides 2
- File Format PPTX
- Slide Ratio 16:9
- Color
Keywords
About the Product
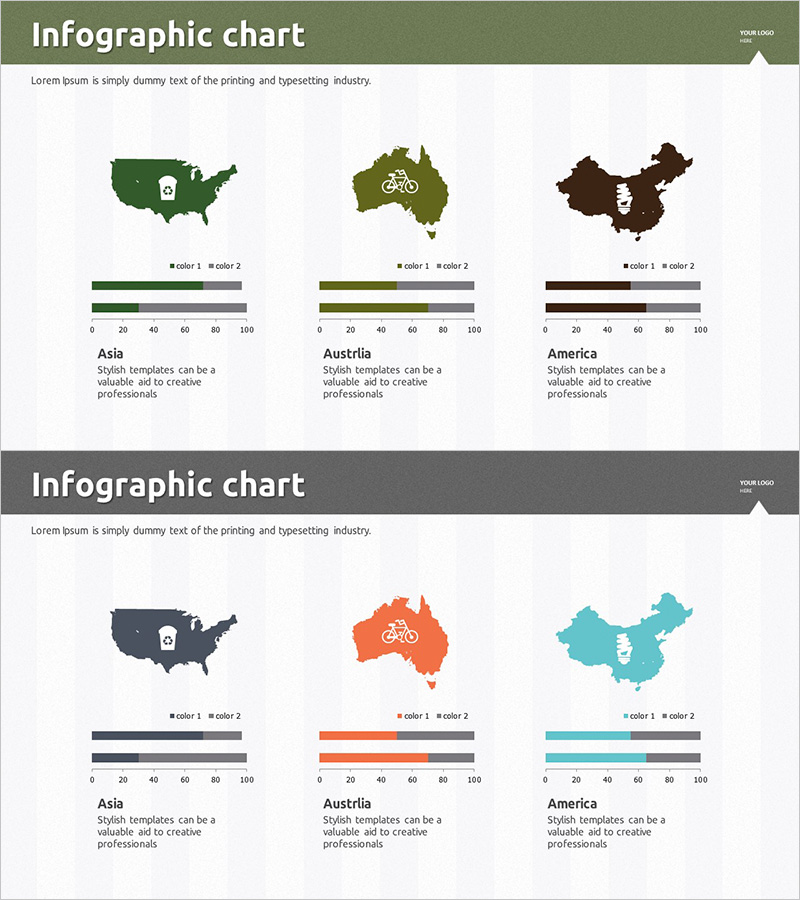
A PowerPoint slide comparing renewable energy market conditions across continents using map visualization and horizontal bar charts. Asia, Austria, and America are represented with distinct color schemes—green, olive, and brown tones—making regional data immediately recognizable. The 0–100 scale bar chart enables quick comparison of market share and growth rates. Two slide layouts are provided with different color themes (dark and light tones) to match your presentation style. Fully editable PPTX format allows you to input your own data and deploy immediately for business reports, market research presentations, and investor pitches.
Usage Points
-
Main Usage
Visualize and compare global renewable energy market size, growth rates, and regional market share in a single slide. Effectively communicate market opportunities and competitive landscape to investors, partners, and stakeholders.
-
How to Use
Insert into the market analysis section of business plans, market research reports, and investor pitch decks. The combined map and bar chart approach helps audiences grasp regional data distribution quickly. Replace colors and values with your own data for immediate deployment.
-
Recommended For
Ideal for renewable energy company executives, marketing teams, and business development professionals presenting global market conditions. Also suitable for consulting firms, investment companies, and government agencies conducting market analysis.
-
Slide Structure
Each slide contains a title area, descriptive text field, map visualization area (three continents with icons), and horizontal bar chart area (0–100 scale). Both slides share identical layout with only color theme variation, allowing flexible selection based on document tone.
Related Products
-

Camping Market Trend Survey Line Graph – Trend Displayed in Orange and Yellow
#Market and Competitor Analysis #Graph #Other
-

Global Market Analysis Using World Map – Sea Lighthouse Concept
#Market and Competitor Analysis #Diagram #Other
-

Green Brown Area Chart – Market and Competitor Analysis
#Market and Competitor Analysis #Graph #Other
-

Global Map Camping Market Analysis by Country – Market Status and Opportunities
#Market and Competitor Analysis #Other #Market Analysis
