Environmental Protection World Map Slide – Blue and Brown Tones
RJ0600015_19
- Last Update 06/24/2025
- File Size 3.2MB
- # of Slides 2
- File Format PPTX
- Slide Ratio 16:9
- Color
Keywords
About the Product
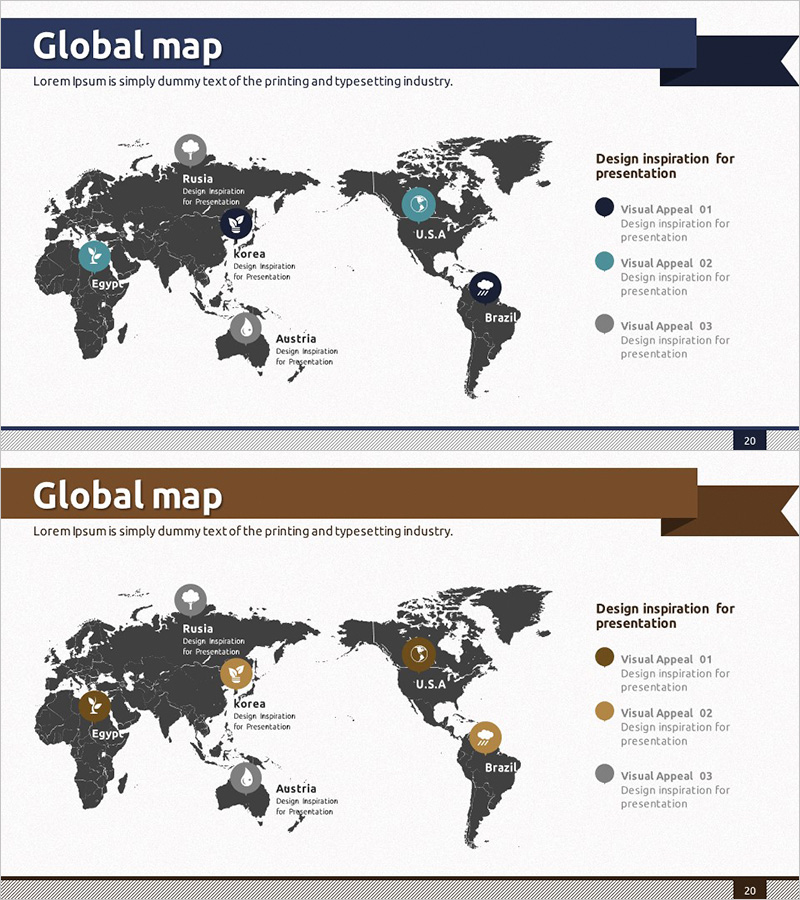
A global market analysis PowerPoint slide featuring a world map with regional markers for international business strategy visualization. The dark gray background map highlights six key regions—Russia, USA, Brazil, Egypt, Korea, and Austria—using three distinct marker colors: blue, brown, and gray. Each region includes dedicated text input areas for entering regional business status, market characteristics, investment data, or partnership information. A legend on the right side clearly categorizes the three marker types for easy interpretation. This 2-slide set provides both blue-tone and brown-tone color versions, allowing you to match your presentation theme and brand colors. Optimized for 16:9 widescreen format, ensuring compatibility with modern presentation environments.
Usage Points
-
Main Usage
Visualizes international business strategy, market analysis, and global network status through map-based representation. Regional markers enable stakeholders to quickly identify key markets, investment targets, and partnership locations, while text areas allow you to input specific data, strategic initiatives, and performance metrics to support decision-making.
-
How to Use
Enter regional business information, market size, investment amounts, or partner details in the text areas next to each country marker. Define the three marker colors to represent business stages (entry, growth, expansion), investment scale (small, medium, large), or market types (emerging, mature, developing). Use blue tones to convey trust and technology focus; brown tones suggest stability and traditional industry positioning.
-
Recommended For
Ideal for global company investor relations presentations, business briefings, and strategic planning meetings. Effectively communicates international market status, regional business portfolios, and global expansion plans to executives, investors, and business partners.
-
Slide Structure
Layout includes: title area (top left) + world map (center) + 6 regional markers + individual text input areas per marker (country name and description) + legend (right side). Both slides maintain identical structure with color variations—blue-tone and brown-tone versions—allowing selection based on presentation context.
Related Products
-

Map Graph on the Background of the Full Moon – Market and Competitor Analysis
#Market and Competitor Analysis #Graph #Other
-

Horizontal Bar Chart Visualizing US Target Market Progress
#Market and Competitor Analysis #Graph #Other
-

Market Analysis with Hologram Map and Chart – Contemporary Visual Design
#Market and Competitor Analysis #Marketing Plan and Strategy #Other
-

Spring PowerPoint World Map – A Visual Tool for Market Analysis
#Market and Competitor Analysis #Other #Market Analysis
