Learning Status Graph – Development Status and Achievements
RJ0500004_14
- Last Update 06/08/2025
- File Size 1.8MB
- # of Slides 2
- File Format PPTX
- Slide Ratio 16:9
- Color
Keywords
- #Content-Based Slides
- #Design-Based Slides
- #Product/Service Introduction
- #Technical Approach
- #Graph
- #Other
- #Development Status
- #Research and Development
- #16:9
- #learning status graph PowerPoint
- #horizontal bar chart slide
- #progress comparison PPT
- #development status slide
- #achievement visualization PowerPoint
About the Product
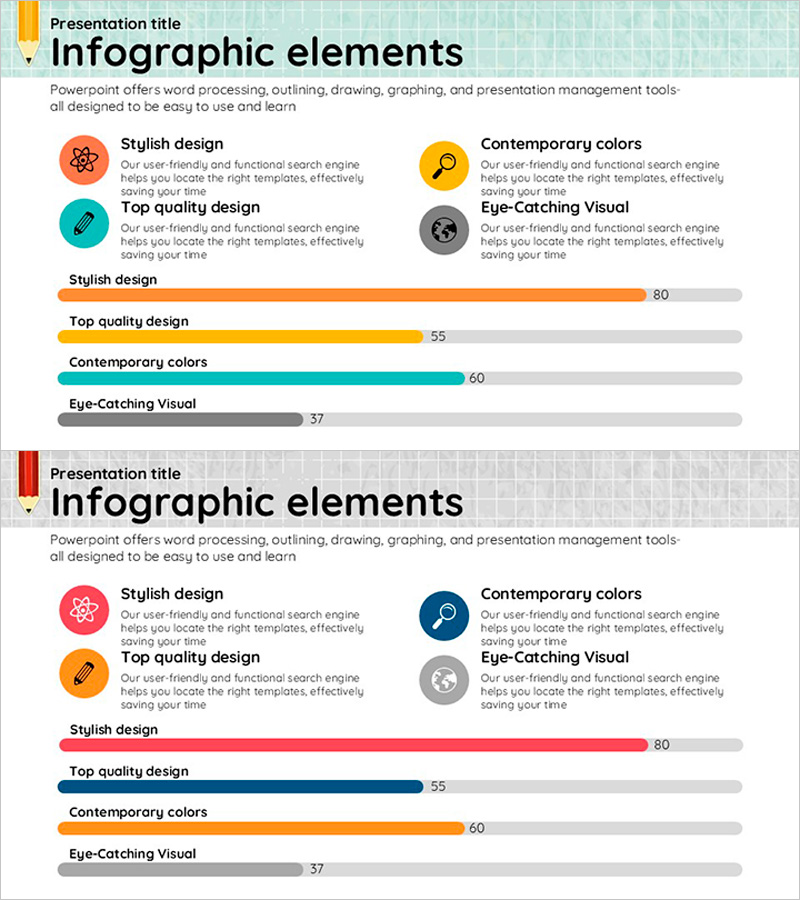
A 2-slide PowerPoint presentation designed to visualize research development and product achievements. The upper section features 4 key elements (Stylish Design, Top Quality Design, Contemporary Colors, Eye-Catching Visual) with icons and descriptive text, while the lower section displays a horizontal bar chart comparing progress metrics (80, 55, 60, 37) for each item. The design uses a vibrant color palette—orange, yellow, teal, and gray—to differentiate each category, optimized for 16:9 widescreen format. Instantly applicable for technology department presentations, product development status reports, and research outcome explanations.
Usage Points
-
Main Usage
Visualize research project progress, product development stage performance, and learning goal achievement rates in a single comparative view to support decision-making. Ideal for weekly/monthly progress reports to technical teams, executive briefings, and investor presentations where performance metrics must be clearly communicated.
-
How to Use
Enter key achievement item names in the 4 icon boxes at the top, then input progress values (0–100) in the horizontal bar chart below. Colors are automatically assigned per item, so you only need to update data without additional formatting. Place the slide in your presentation sequence for technology briefings, research reports, or product development status discussions.
-
Recommended For
R&D team leads, technical managers, product development managers, research directors, and technical sales representatives presenting development progress and achievements in internal meetings, executive reports, and client presentations. Particularly effective when comparing completion rates across multiple project phases.
-
Slide Structure
The slide consists of 2 sections: the upper area contains a title zone and 4 icon boxes (each with item name and description text fields), while the lower area displays a horizontal bar chart with 4 progress bars in distinct colors showing numerical metrics. The color differentiation enables easy comparative analysis.
Related Products
-

Analysis of Major Business Marketing Activities – Green Mint
#Product/Service Introduction #Marketing Plan and Strategy #Graph
-

Donut Chart for Comparing Research Analysis Results
#Product/Service Introduction #Technical Approach #Graph
-

Current Status of Financial Services System Slide – Data and Insights
#Product/Service Introduction #Business Vision and Strategy #Diagram
-

Chemical Experiment Research Analysis Diagram – Innovation and Progress
#Company Introduction #Product/Service Introduction #Diagram
