Renewable Energy Competitor Analysis Horizontal Bar Chart – Policies for a Sustainable Future
RJ0600048_24
- Last Update 07/03/2025
- File Size 1.9MB
- # of Slides 2
- File Format PPTX
- Slide Ratio 16:9
- Color
Keywords
- #Content-Based Slides
- #Design-Based Slides
- #Business Strategy
- #Corporate Social Responsibility
- #Graph
- #Achievements
- #Sustainability Programs
- #Horizontal Bar
- #Horizontal Bar Chart
- #16:9
- #horizontal bar chart PowerPoint
- #bar graph presentation slide
- #data comparison chart
- #renewable energy presentation
- #competitor analysis graph
About the Product
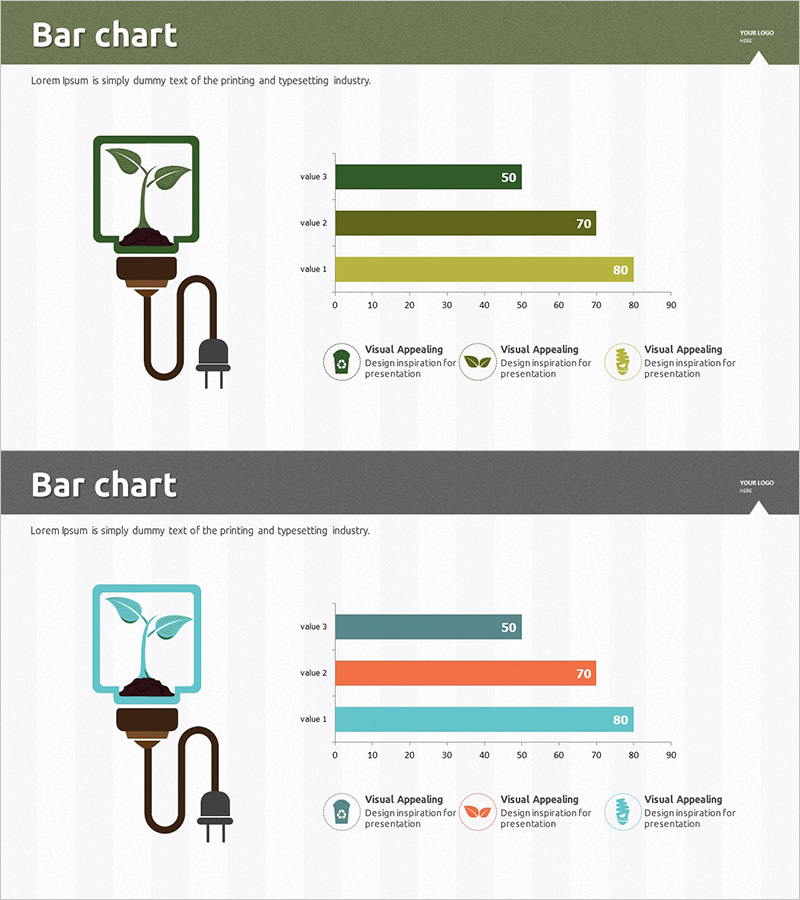
A horizontal bar chart PowerPoint slide optimized for renewable energy and environmental policy presentations. This template provides 2 design variations for comparing numerical data across 3 items in a horizontal layout. The first slide features gradient bars in green, olive, and lime tones to represent nature and sustainability, while the second uses teal, orange, and light green colors to distinguish different energy sources. Numerical labels are clearly displayed at the end of each bar for excellent data readability. Plant and lightbulb icons on the left emphasize the energy theme, and a legend at the bottom conveys the meaning of each item intuitively. This presentation slide is ready to use immediately for competitive analysis, market share comparison, policy effectiveness evaluation, and other business contexts requiring data visualization.
Usage Points
-
Main Usage
Visual comparison of numerical data across 3 items in horizontal layout. Ideal for renewable energy policy presentations, competitive analysis, market share comparison, and sales volume analysis. The bar length intuitively conveys relative magnitude, enhancing audience comprehension of quantitative comparisons.
-
How to Use
Replace the 'value 1, value 2, value 3' text and numerical labels with your own data. Bar colors can be customized to match your presentation theme, and legend icons can be adapted for different industries. Choose between the 2 color versions based on your presentation's overall tone and design direction.
-
Recommended For
Environmental and renewable energy policy presentations, competitive analysis reports for energy companies, market research and comparative analysis decks, ESG performance reporting, government and public sector policy impact presentations. Suitable for marketing teams, strategy departments, policy officers, environmental consultants, and sustainability professionals.
-
Slide Structure
2-slide template. Each slide includes a title area, 3-item horizontal bar graph (0-90 scale), numerical labels, left-side icons (plant and lightbulb), and bottom legend with 3-item descriptions. Optimized for 16:9 widescreen format, compatible with modern presentation environments.
Related Products
-

Striking Performance Gap in Agricultural Outcomes
#Business Strategy #Financial Plans and Performance #Graph
-

Popular Snack Graph for Revenue Visualization – Simplicity and Intuition
#Business Strategy #Financial Plans and Performance #Graph
-

Revenue Breakthrough: Achieving All-Time Highs with Bar Graphs
#Business Strategy #Financial Plans and Performance #Graph
-

Strategic Goal Progress Template
#Business Strategy #Diagram #Graph
