Renewable Energy Target Market Strategy Icon
RJ0600048_19
- Last Update 07/03/2025
- File Size 1.9MB
- # of Slides 2
- File Format PPTX
- Slide Ratio 16:9
- Color
Keywords
- #Content-Based Slides
- #Design-Based Slides
- #Business Strategy
- #Market and Competitor Analysis
- #Diagram
- #Achievements
- #Market Share
- #Cluster
- #Closed Cluster Diagram
- #16:9
- #icon PowerPoint slide
- #renewable energy presentation
- #market strategy diagram
- #circular layout icons
- #environmental policy slide
- #sustainable business template
- #4-item comparison slide
About the Product
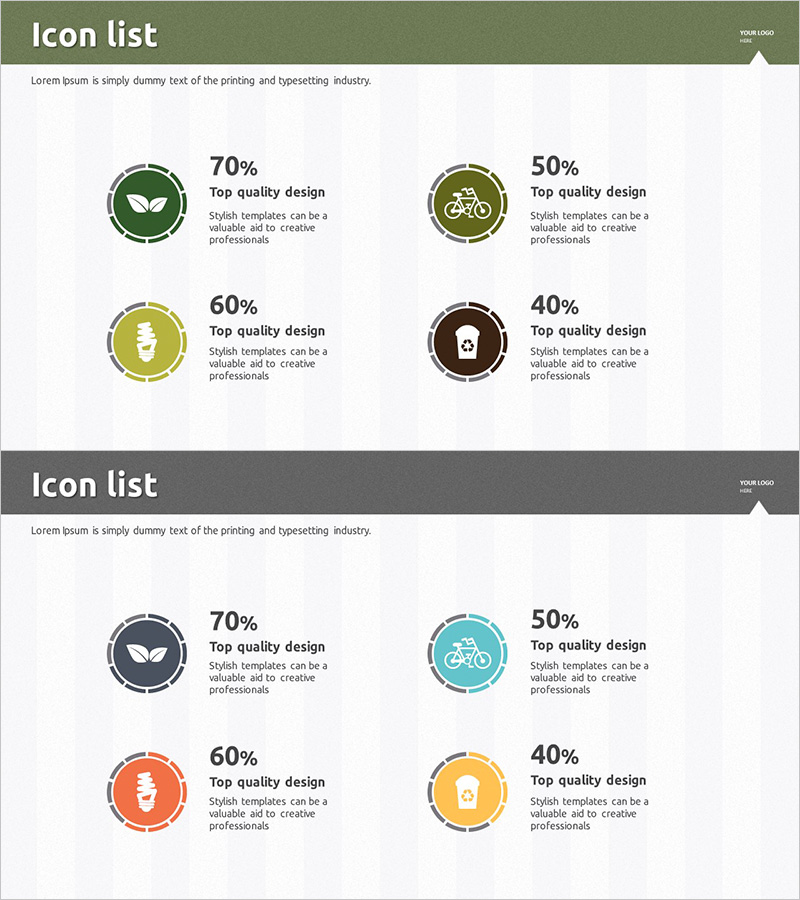
A 4-item circular icon slide for visualizing renewable energy and sustainable business strategies. Features circular badges in green, yellow, blue, and brown tones, each containing leaf, bicycle, lightbulb, and recycling symbols with percentage values displayed. This PowerPoint presentation slide is ready to use in environmental policy, renewable energy targets, market analysis, and competitive comparison sections. The 2-slide set offers multiple color arrangement options with fully editable text, allowing customization to match your corporate brand identity and presentation style.
Usage Points
-
Main Usage
Visualizes renewable energy, environmental policy, and sustainable business strategy across 4 key categories using circular badge icons. The symbols and percentage values enable quick comparison of importance, targets, and performance metrics. Ideal for board reports, investor presentations, and policy briefings.
-
How to Use
Enter renewable energy types (solar, wind, hydro, biomass, etc.) into each of the 4 circular badges and update percentage values. Customize colors to match your corporate brand palette. Add strategic descriptions, goals, and performance data in the text areas to complete your presentation.
-
Recommended For
Energy and environmental professionals, renewable policy planners, sustainability report authors, green industry consultants, and CSR marketing teams preparing policy briefings, corporate presentations, and investor pitch decks.
-
Slide Structure
2-slide set with the first slide displaying 4 circular badges in a 2×2 grid layout, each containing a symbol icon and percentage value. The second slide provides an alternative color arrangement. All text, numbers, and colors are fully editable for brand customization.
Related Products
-

Donut Charts of Animals and Plants – Effective Market Analysis Tool
#Business Strategy #Market and Competitor Analysis #Diagram
-

Market Share Donut Pie Chart
#Product/Service Introduction #Market and Competitor Analysis #Diagram
-

Market Share by Instrument Visualization – Donut Chart for Market Analysis
#Market and Competitor Analysis #Diagram #Graph
-

Market Share Analysis by Sector Pie Chart
#Product/Service Introduction #Market and Competitor Analysis #Diagram
