Performance and Future Outlook Graph – Harmony of Blue and Red
RJ0400020_9
- Last Update 05/23/2025
- File Size 0.3MB
- # of Slides 2
- File Format PPTX
- Slide Ratio 16:9
- Color
Keywords
- #Content-Based Slides
- #Design-Based Slides
- #Business Strategy
- #Market and Competitor Analysis
- #Graph
- #Other
- #Achievements
- #Future Outlook
- #16:9
- #performance area chart PowerPoint slide
- #future outlook chart template
- #two-layer area graph slide
- #business performance PPT
- #data visualization PowerPoint
About the Product
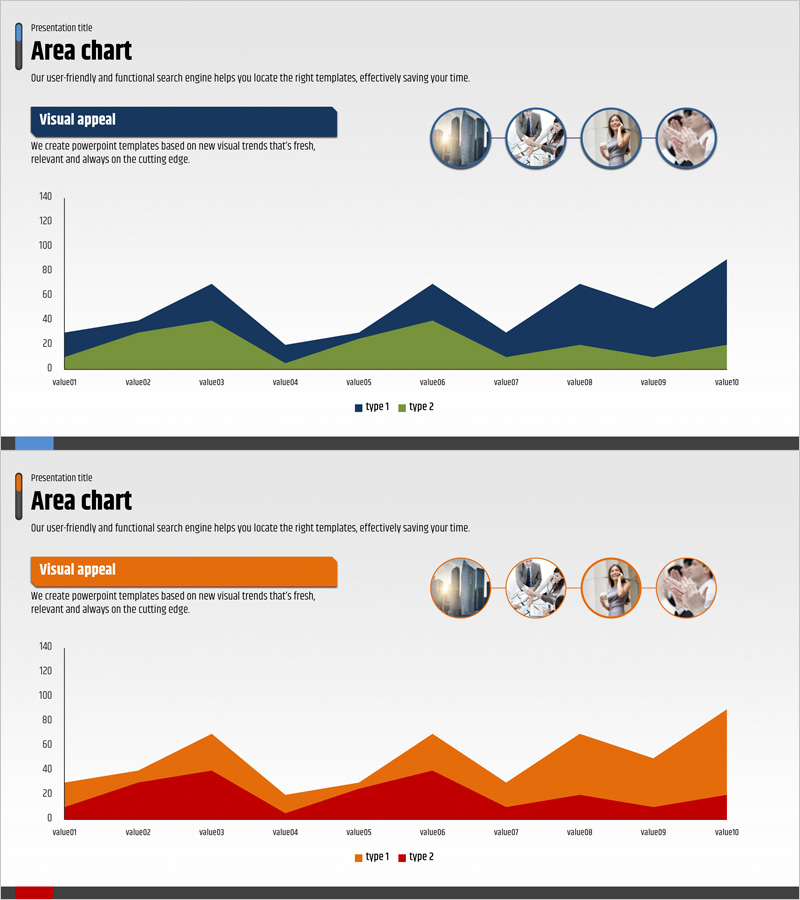
A PowerPoint area chart slide that compares business performance and future outlook across two data types. The first slide features a dark blue and lime green color scheme, while the second uses orange and red tones, each visualizing 10 time-series data points. The top section includes a title and description text area, plus four circular image insertion spaces for team introductions or stakeholder information. This slide is ideal for investor presentations, executive reports, and business performance sharing, supporting data-driven decision-making across various presentation contexts.
Usage Points
-
Main Usage
Visually compare business performance trends and future projections while delivering data-driven insights to investors, executives, and stakeholders. The two color-coded data types enable simultaneous representation of different scenarios or departmental performance metrics.
-
How to Use
Customize the title and description text at the top to match your presentation topic. Insert team photos or stakeholder information into the four circular image areas. Replace chart data values with your actual performance figures to create a presentation-ready slide.
-
Recommended For
Recommended for business performance reports, quarterly and annual executive briefings, investor relations materials, strategic planning meetings, and business plan presentations. Ideal for finance teams, strategy departments, sales leaders, and executives comparing historical performance against future targets.
-
Slide Structure
Each slide contains a top title and description text area, four circular image insertion spaces on the right, and a bottom area chart with two data layers across 10 time periods. A legend at the bottom clearly distinguishes Type 1 and Type 2 data series.
Related Products
-

Exercise Ability Improvement Graph
#Business Strategy #Market and Competitor Analysis #Graph
-

Climbing Silhouette and Volume Graph for Performance Visualization – Challenge and Overcoming
#Business Strategy #Graph #Other
-

Graph Analyzing Lung Cancer Treatment Trends – Market Potential and Future Outlook
#Business Strategy #Market and Competitor Analysis #Graph
-

Changes in the Region Graph – Business Strategy and Outcomes
#Business Strategy #Graph #Other
