Vegetable Table Analysis – Emphasis on Financial Performance
RJ0600046_7
- Last Update 07/03/2025
- File Size 1.4MB
- # of Slides 2
- File Format PPTX
- Slide Ratio 16:9
- Color
Keywords
- #Content-Based Slides
- #Design-Based Slides
- #Financial Plans and Performance
- #Diagram
- #Projected Return on Investment (ROI)
- #Key Financial Indicators
- #Table
- #16:9
- #data comparison table PowerPoint
- #financial analysis presentation slide
- #dual-color table design
- #performance comparison chart slide
- #numerical data visualization PPT
About the Product
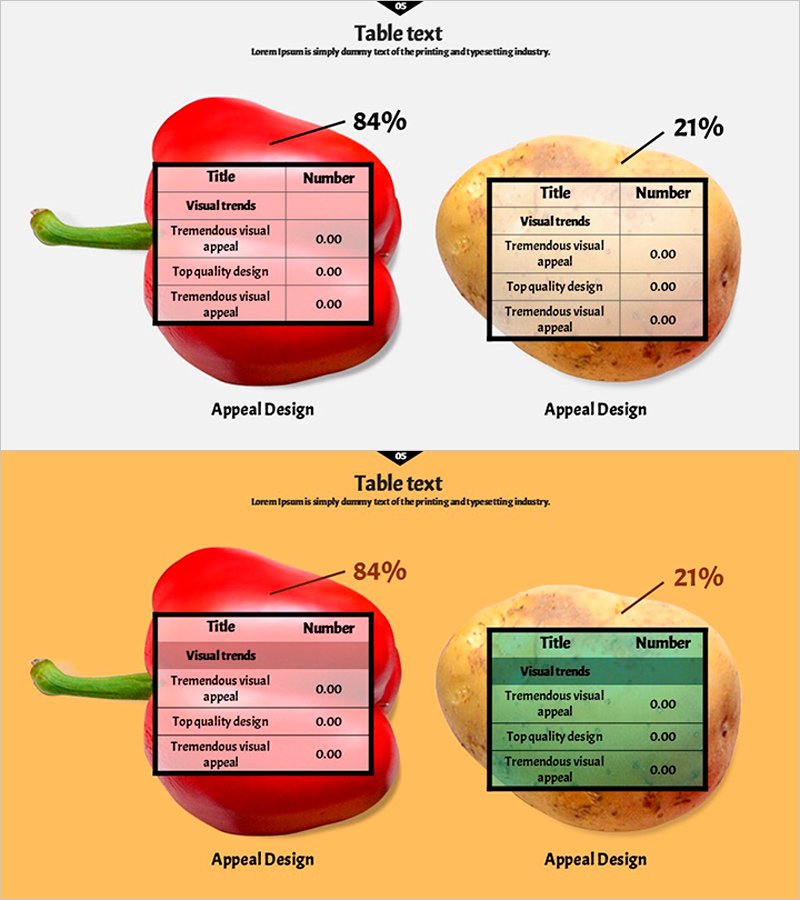
A 2-slide PowerPoint table template designed for financial performance and data comparison presentations. Features a striking dual-color layout with red and beige backgrounds paired with pink and green table headers, creating strong visual contrast for clear data distinction. Each slide provides a 4-row, 2-column input structure with percentage metrics (84%, 21%) and visual emphasis elements. Ready-to-use for investor presentations, financial reports, and performance analysis materials.
Usage Points
-
Main Usage
Presents financial data, performance metrics, and comparative analysis information in clear table format. Simultaneously displays percentage figures and category-specific data to strengthen decision-making evidence.
-
How to Use
Apply to investor relations materials, financial reports, quarterly performance presentations, and investor meeting decks. Edit table titles, row items, and numerical values with your actual data, then use background and header colors to differentiate categories and improve readability.
-
Recommended For
CFOs, finance managers, investor relations professionals, and executives presenting financial performance and comparative analysis. Ideal for meetings and presentations requiring quantitative data-driven decision-making.
-
Slide Structure
2-slide composition. Each slide contains one title area and one 4-row, 2-column table. Table structure includes header row (title and metrics) plus 4 data rows (item names and values), with background color contrast clarifying information hierarchy.
Related Products
-

New Semester Template Table – Visualizing Financial Planning and Performance
#Financial Plans and Performance #Diagram #Projected Return on Investment (ROI)
-

Data Table Slide | Numerical Comparison & Summary Report PPT
#Financial Plans and Performance #Diagram #Projected Return on Investment (ROI)
-

Business Table Charts – Intuitively Presenting Financial Performance
#Financial Plans and Performance #Diagram #Projected Return on Investment (ROI)
-

Business Income Statement – Visualizing Financial Performance
#Financial Plans and Performance #Diagram #Income Statement
