Business Table Charts – Intuitively Presenting Financial Performance
RJ0600001_14
- Last Update 06/21/2025
- File Size 0.5MB
- # of Slides 2
- File Format PPTX
- Slide Ratio 16:9
- Color
Keywords
- #Content-Based Slides
- #Design-Based Slides
- #Financial Plans and Performance
- #Diagram
- #Projected Return on Investment (ROI)
- #Key Financial Indicators
- #Table
- #Standard Table
- #16:9
- #data table PowerPoint slide
- #financial table template
- #business comparison chart
- #numerical data presentation
- #spreadsheet slide design
- #how to create data table in PowerPoint
About the Product
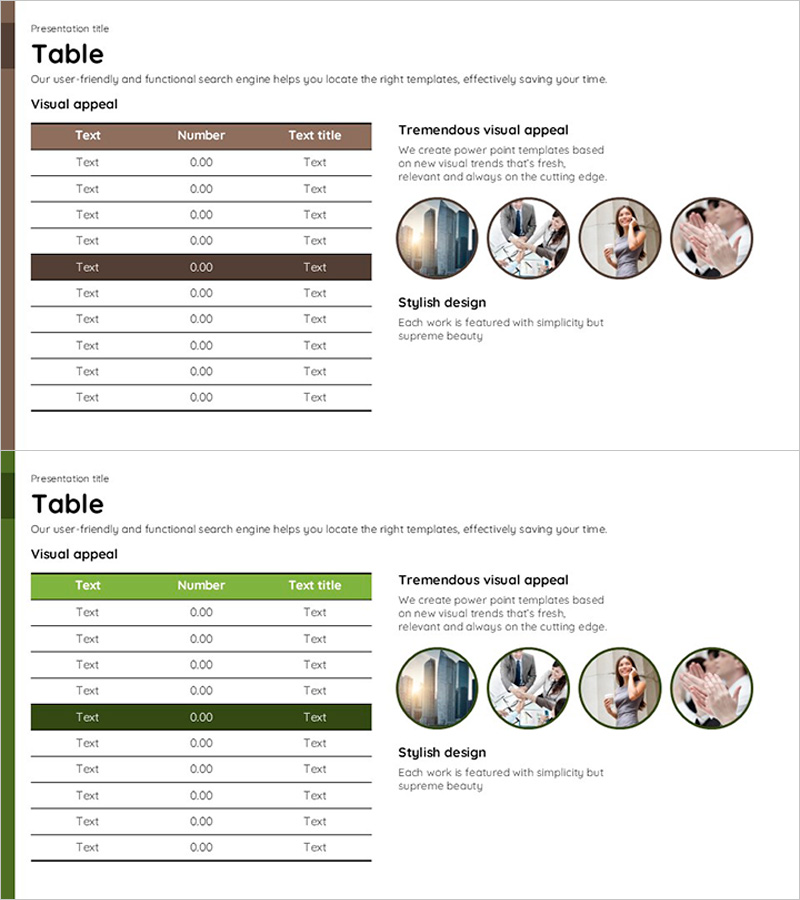
Essential data table PowerPoint slides for business presentations. This template features two color variations: brown and green header designs, each with a 3-column structure (text, number, title) for organizing information. Perfect for presenting financial performance, return on investment, budget planning, and comparative analysis. The slides include 10 rows of input fields to accommodate substantial data volume, with emphasized header rows in darker backgrounds. These presentation slides are ready to use immediately in financial reports, performance analysis sections, and executive summaries.
Usage Points
-
Main Usage
Organize and present financial metrics, ROI figures, budget allocations, and sales performance data in a clear tabular format. Enables side-by-side comparison of multiple data points and is optimized for quarterly and annual performance reviews.
-
How to Use
Enter item names in the text column and corresponding numerical values in the number column. Customize header row titles to clarify the table's purpose. Add or remove rows as needed to match your data volume. Modify color schemes to align with corporate branding guidelines.
-
Recommended For
Ideal for finance teams, executives, and business development professionals presenting quarterly or annual performance reports. Suitable for investor presentations, board meeting materials, and marketing performance analysis decks where data credibility is essential.
-
Slide Structure
Two-slide set with identical 3-column (text, number, title) and 10-row input structure. First slide features brown header styling, second features green header styling, providing color variation options. Both slides are in 16:9 widescreen PPTX format for universal compatibility.
Related Products
-

Data Table Slide | Numerical Comparison & Summary Report PPT
#Financial Plans and Performance #Diagram #Projected Return on Investment (ROI)
-

New Semester Template Table – Visualizing Financial Planning and Performance
#Financial Plans and Performance #Diagram #Projected Return on Investment (ROI)
-

Table Chart with Light Background – Financial Planning Tool
#Financial Plans and Performance #Diagram #Cash Flow Statement
-

Patient Examination Item Table Slide – Efficient Data Management
#Financial Plans and Performance #Diagram #Capital Requirements
