New Semester Template Table – Visualizing Financial Planning and Performance
RJ0500043_23
- Last Update 06/19/2025
- File Size 1.6MB
- # of Slides 2
- File Format PPTX
- Slide Ratio 16:9
- Color
Keywords
- #Content-Based Slides
- #Design-Based Slides
- #Financial Plans and Performance
- #Diagram
- #Projected Return on Investment (ROI)
- #Key Financial Indicators
- #Table
- #Standard Table
- #16:9
- #financial data table PowerPoint slide
- #comparison table template
- #budget report slide
- #7-row data table
- #performance metrics visualization
- #table slide design download
About the Product
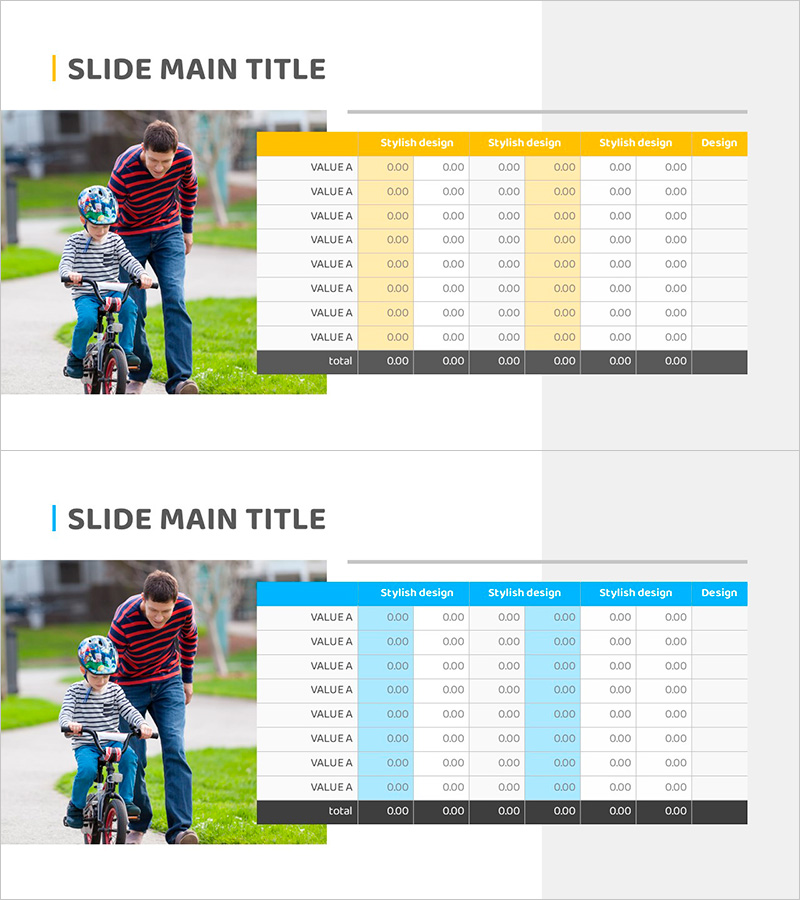
A horizontal table-format PowerPoint slide designed to compare financial planning and performance metrics for new semester presentations. This slide template features 7 data rows (VALUE A) and 7 columns with input fields for numerical data. Choose between yellow or blue header styling to match your presentation tone. The table includes an automatic total calculation row, making it ideal for financial reports, performance analysis, budget status updates, and quarterly reviews. Delivered as 2 slides in 16:9 widescreen PPTX format, fully editable and ready to use.
Usage Points
-
Main Usage
Visualize numerical data—financial figures, performance indicators, budget allocations—in an organized table format that enables audiences to compare values across rows and columns instantly. The total row provides immediate insight into aggregate figures.
-
How to Use
Enter financial data, KPIs, sales figures, or performance metrics into each cell. Select yellow headers for dynamic, positive messaging or blue headers to emphasize stability and trust. Duplicate the table structure to add more rows or columns as needed for your dataset.
-
Recommended For
CFOs and finance teams presenting quarterly or annual financial reports, marketing teams analyzing campaign performance, sales teams showcasing revenue metrics, executive dashboards for board meetings, and training sessions explaining financial concepts to new employees.
-
Slide Structure
2-slide set. Each slide contains a horizontal table with 7 rows (VALUE A entries plus total row) and 7 columns (Stylish design header plus 6 data columns). Headers are available in yellow or blue; data cells feature white backgrounds with 0.00 format input fields for easy data entry.
Related Products
-

Business Table Charts – Intuitively Presenting Financial Performance
#Financial Plans and Performance #Diagram #Projected Return on Investment (ROI)
-

Data Table Slide | Numerical Comparison & Summary Report PPT
#Financial Plans and Performance #Diagram #Projected Return on Investment (ROI)
-

Key Financial Indicators Comparison – Cash Flow and Performance Analysis
#Financial Plans and Performance #Diagram #Cash Flow Statement
-

Simple Yellow Purple Table – Financial Performance Visualization
#Financial Plans and Performance #Diagram #Balance Sheet
