Highlight Graph and Analytical Text – Emphasizing Results and Competitive Advantage
RJ0600046_6
- Last Update 07/03/2025
- File Size 0.4MB
- # of Slides 2
- File Format PPTX
- Slide Ratio 16:9
- Color
Keywords
- #Content-Based Slides
- #Design-Based Slides
- #Company Introduction
- #Market and Competitor Analysis
- #Graph
- #Key Achievements
- #Competitive Advantage
- #Horizontal Bar
- #Grouped Horizontal Bar
- #16:9
- #horizontal bar chart PowerPoint
- #bar graph slide template
- #trend comparison chart
- #data visualization presentation
- #how to create bar chart in PowerPoint
About the Product
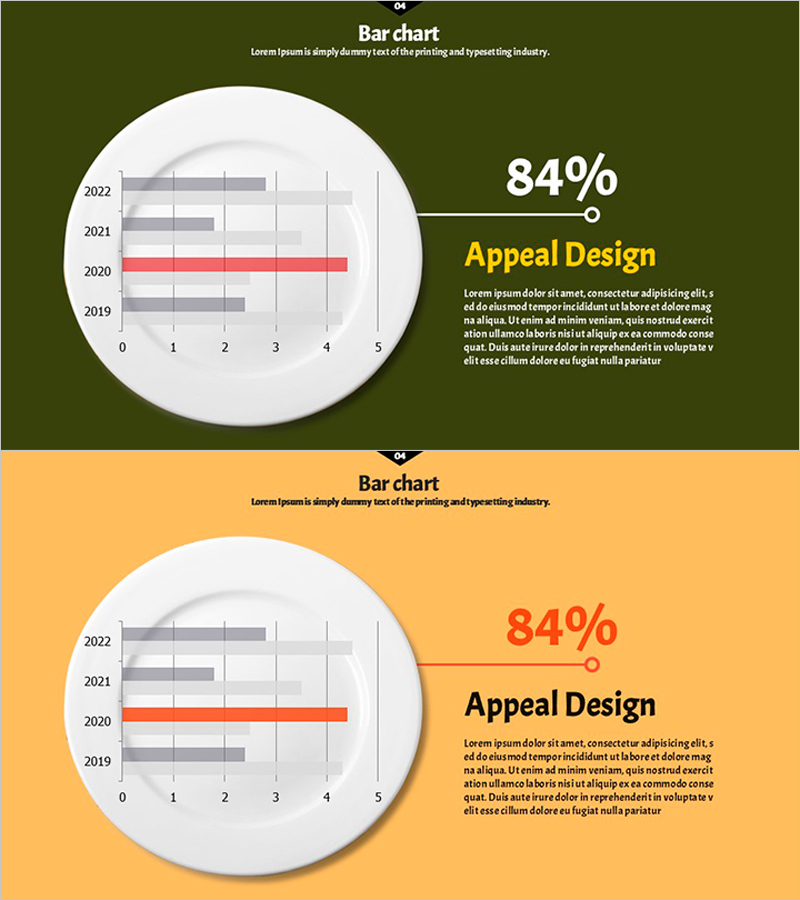
A horizontal bar chart PowerPoint slide that visually emphasizes year-over-year data changes from 2019 to 2022. The design highlights a specific year (2020) in red to draw attention to key performance metrics or significant shifts. The circular frame background and grid lines enhance data readability, while the right-side text area displays an 84% metric and 'Appeal Design' label for emphasizing core messages. Available in two color schemes—dark olive and yellow backgrounds—this presentation slide is ready to use for market analysis, competitive comparison, performance reporting, and other business presentations.
Usage Points
-
Main Usage
Intuitively compare year-over-year or item-by-item metrics while using red emphasis to highlight key performance changes. The right-side text area supports presenter narration by displaying critical figures and insights alongside the chart.
-
How to Use
Two-slide set with dark olive and yellow backgrounds respectively. Modify bar lengths and colors to match your data, then update the right-side text box with key metrics and analysis. Grid lines and axis labels adjust automatically to accommodate your values.
-
Recommended For
Executive reports, quarterly performance reviews, market analysis, competitive benchmarking, investor presentations, and marketing performance summaries for roles requiring data-driven decision support.
-
Slide Structure
Each slide features a horizontal bar chart (4 data points for years 2019–2022) within a circular frame, paired with a right-side text area for metrics and messaging. Bars use gray as default and red for emphasis, with grid lines (0–5 range) and year labels included.
Related Products
-

Planterior Market Overview – Insights through Horizontal Bar Graph
#Market and Competitor Analysis #Graph #Market Overview
-

Business Forest Wide Template Bar Chart – Market Analysis and Competitive Strategy
#Market and Competitor Analysis #Marketing Plan and Strategy #Graph
-

Achievement Status Bar Graph – Key Performance and Competitive Advantage
#Company Introduction #Market and Competitor Analysis #Graph
-

Children's Depression Index Trends – Insights Through Customer Analysis
#Market and Competitor Analysis #Graph #Customer Analysis
