Children's Depression Index Trends – Insights Through Customer Analysis
RJ0500042_31
- Last Update 06/19/2025
- File Size 0.5MB
- # of Slides 2
- File Format PPTX
- Slide Ratio 16:9
- Color
Keywords
- #Content-Based Slides
- #Design-Based Slides
- #Market and Competitor Analysis
- #Graph
- #Customer Analysis
- #Competitive Advantage
- #Horizontal Bar
- #Grouped Horizontal Bar
- #16:9
- #grouped horizontal bar chart PowerPoint
- #comparative analysis slide template
- #data visualization chart
- #trend analysis graph
- #how to create bar chart in PowerPoint
About the Product
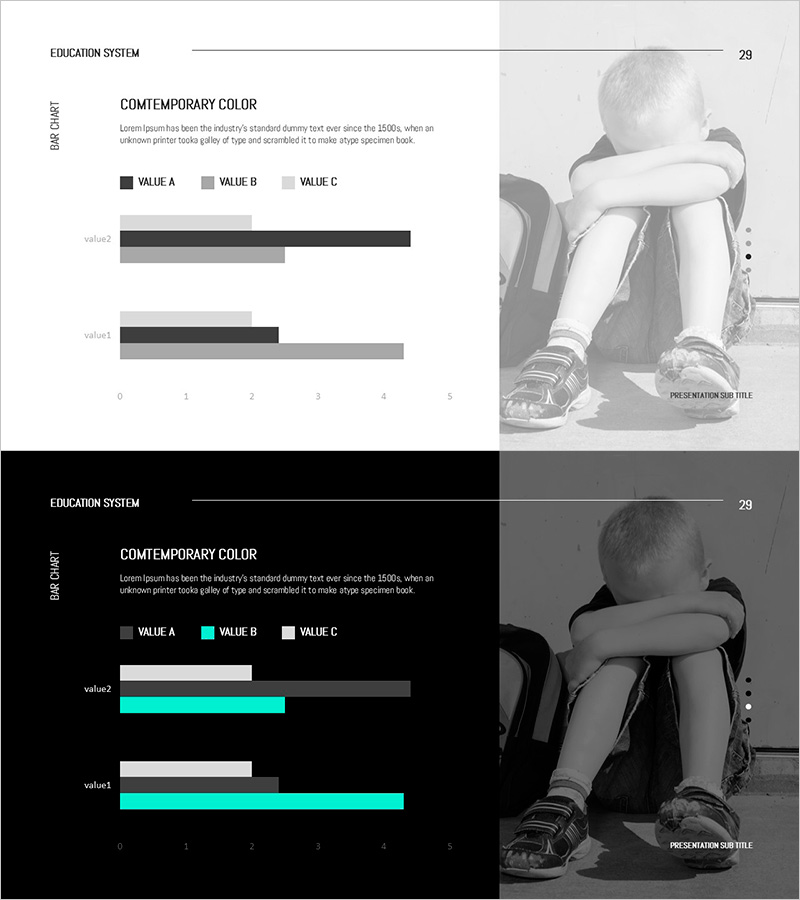
A grouped horizontal bar chart PowerPoint slide designed to visualize children's depression index trends and comparative analysis. This presentation template displays two data series side-by-side, enabling simultaneous representation of temporal changes and item-to-item comparisons. The color scheme features light gray, dark charcoal, and medium gray tones, making it ideal for customer analysis reports, market research presentations, and educational statistics briefings. Available in 16:9 widescreen PPTX format with fully editable elements. Simply input your numerical data and the bar lengths adjust automatically for quick customization.
Usage Points
-
Main Usage
Designed to compare numerical changes across two or more items over time while clearly revealing trends. Ideal for displaying customer satisfaction, sales volume, index fluctuations, and other multi-series datasets at a glance.
-
How to Use
Insert into the data section of reports, proposals, and analytical documents to emphasize numerical comparisons and trend analysis. Customize bar lengths and modify legends to match your specific dataset requirements.
-
Recommended For
Marketing analysts, HR professionals, education statisticians, market research specialists, and executives preparing performance reports benefit from this template for visualizing customer segmentation, performance comparisons, and trend analysis.
-
Slide Structure
Two-slide set, each containing a grouped horizontal bar chart with two data series. Features value2 and value3 data items differentiated by three tones (VALUE A dark, VALUE B medium, VALUE C light). Includes a 0-5 scale axis and legend for clear data interpretation.
Related Products
-

Product Analysis Comparison Graph – Visualizing Market Status
#Market and Competitor Analysis #Graph #Market Status
-

Contrasting Reactions and Results
#Operational Plan #Market and Competitor Analysis #Text Box
-

Vertical Bar Chart Slide for Data Comparison
#Market and Competitor Analysis #Graph #Competitor Analysis
-

Statistics on People's Physical Fitness in Bar Chart – Insights Aimed at Competitive Advantage
#Market and Competitor Analysis #Graph #Other
