Double Horizontal Bar Graph for Market Analysis – Competitive Advantage and Future Outlook
RJ0600005_17
- Last Update 06/22/2025
- File Size 2.6MB
- # of Slides 2
- File Format PPTX
- Slide Ratio 16:9
- Color
Keywords
- #Content-Based Slides
- #Design-Based Slides
- #Market and Competitor Analysis
- #Graph
- #Future Outlook
- #Competitive Advantage
- #Horizontal Bar
- #Double Horizontal Bar
- #16:9
- #double horizontal bar chart PowerPoint
- #comparative bar graph slide
- #market analysis chart template
- #competitive analysis slide
- #data comparison presentation
About the Product
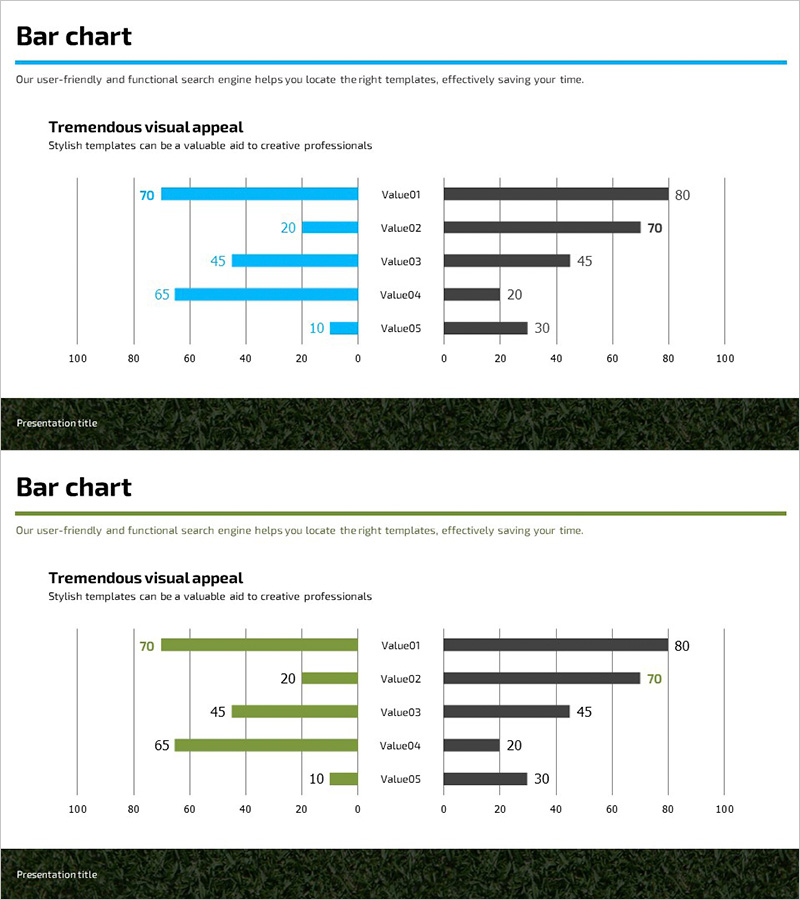
A dual horizontal bar chart PowerPoint slide optimized for market analysis and competitive advantage comparison. This presentation template features two contrasting data series—blue bars on the left and black bars on the right—enabling intuitive side-by-side numerical comparison across five items (Value01 through Value05) with values of 70, 20, 45, 65, and 10. The horizontal bar structure clearly visualizes data magnitude differences, making it ideal for competitive benchmarking, market share analysis, and performance metrics. Delivered in 16:9 PPTX format with 2 slides, fully editable for immediate use in business reports, proposals, strategic presentations, and investor pitches.
Usage Points
-
Main Usage
This slide enables direct comparison of two data series across multiple items using a dual horizontal bar structure. Perfect for market analysis presentations comparing competitor performance, business reports showing target vs. actual results, and proposals demonstrating product feature comparisons.
-
How to Use
Input your data into the left blue bars and right black bars to display item-by-item numerical comparisons. Edit the five item labels and corresponding values, adjust colors to match your brand identity, and customize the number of items as needed. The horizontal layout accommodates easy data scaling and modification.
-
Recommended For
Marketing managers, strategic planners, sales executives, financial analysts, and consultants presenting competitive analysis, market reports, and performance comparisons. Suitable for business plans, quarterly performance reports, investor pitch decks, proposals, and marketing strategy documents.
-
Slide Structure
Two-slide set featuring dual horizontal bar charts in different color schemes—blue series on the first slide and green series on the second. Each slide displays five items with left and right bars positioned symmetrically, supported by gridlines and numerical labels for precise data interpretation.
Related Products
-

Car Wide Template Bilateral Bar Graph
#Market and Competitor Analysis #Graph #Competitor Analysis
-

Comparison Emphasis Line Graph & Explanatory Text – Market Analysis and Competitive Advantage
#Market and Competitor Analysis #Graph #Future Outlook
-

Bar Graph for Competitor Analysis – Business Advantage
#Market and Competitor Analysis #Graph #Competitor Analysis
-

Create Line Charts with Rainbow Paper Template
#Market and Competitor Analysis #Graph #Future Outlook
