Navy-Orange 100% Stacked Chart
RJ0600045_12
- Last Update 07/02/2025
- File Size 0.4MB
- # of Slides 2
- File Format PPTX
- Slide Ratio 16:9
- Color
Keywords
- #Content-Based Slides
- #Design-Based Slides
- #Market and Competitor Analysis
- #Graph
- #Industry Trends
- #Horizontal Bar
- #Segmented Horizontal Bar
- #16:9
- #100% stacked column chart PowerPoint
- #horizontal bar graph template
- #year-over-year comparison slide
- #market trend visualization
- #proportion chart PPT
- #data visualization slide download
About the Product
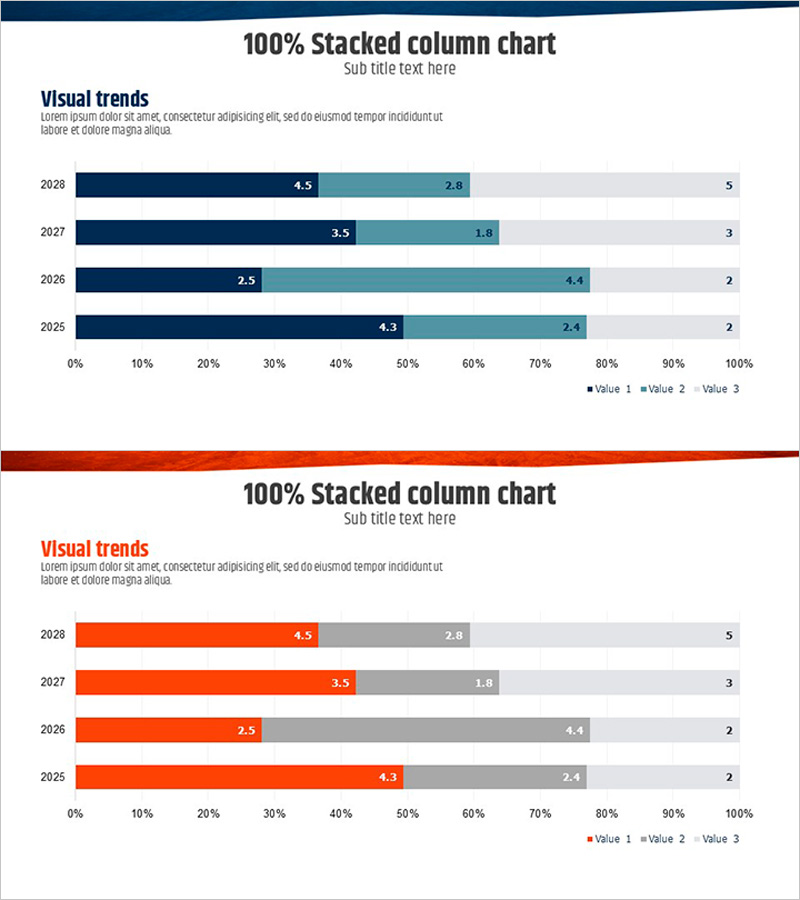
A 100% stacked column chart PowerPoint slide optimized for year-over-year data comparison and market trend analysis. Featuring four data series in navy, light blue, orange, and gray, this slide visualizes proportional changes across 2025 to 2028 with precise numerical labels for each year. The horizontal stacked structure enables intuitive comparison between categories and clear visualization of composition shifts. Ideal for market analysis presentations, competitive benchmarking reports, business performance reviews, and strategic planning sessions. Fully editable and ready to customize with your own data.
Usage Points
-
Main Usage
Visualizes proportional changes in data across multiple time periods or categories. By displaying composition as a percentage of 100%, this chart effectively communicates shifts in market share, revenue mix, customer segments, or resource allocation over time.
-
How to Use
Insert into business performance reports, market analysis presentations, or competitive analysis decks within the data or findings section. Replace sample values with your actual data and adjust color schemes to match corporate branding. Works seamlessly in investor presentations and strategic planning meetings.
-
Recommended For
Finance professionals, marketing strategists, business analysts, management consultants, and executives preparing data-driven presentations. Particularly valuable for multi-year trend analysis, board-level reporting, investor relations, and strategic decision-making contexts.
-
Slide Structure
Two-slide set featuring identical 100% stacked column layouts in navy and orange color schemes. Each slide displays four data series across four years (2025–2028) with labeled values. Formatted in 16:9 widescreen aspect ratio for modern presentation environments and compatible with PowerPoint editing.
Related Products
-

World Travel Template Horizontal Bar Segment Chart
#Market and Competitor Analysis #Graph #Industry Trends
-

Paint Piano and Segmentation Bar Graph – Market Trend Analysis
#Market and Competitor Analysis #Graph #Market Analysis
-

Eco-friendly Business Market Share Segmentation Horizontal Bar Chart
#Market and Competitor Analysis #Graph #Industry Trends
-

Animal Natural Environment Improvement Rate Future Outlook Horizontal Bar Chart
#Market and Competitor Analysis #Graph #Industry Trends
