Match Illustration Bar Chart – Performance and Market Analysis
RJ0600044_15
- Last Update 07/02/2025
- File Size 6.9MB
- # of Slides 2
- File Format PPTX
- Slide Ratio 16:9
- Color
Keywords
- #Content-Based Slides
- #Design-Based Slides
- #Business Strategy
- #Market and Competitor Analysis
- #Diagram
- #Graph
- #Achievements
- #Market Analysis
- #Table
- #Standard Table
- #16:9
- #bar chart PowerPoint
- #match illustration slide
- #horizontal bar graph template
- #performance analysis presentation
- #market data visualization
- #trend comparison slide
About the Product
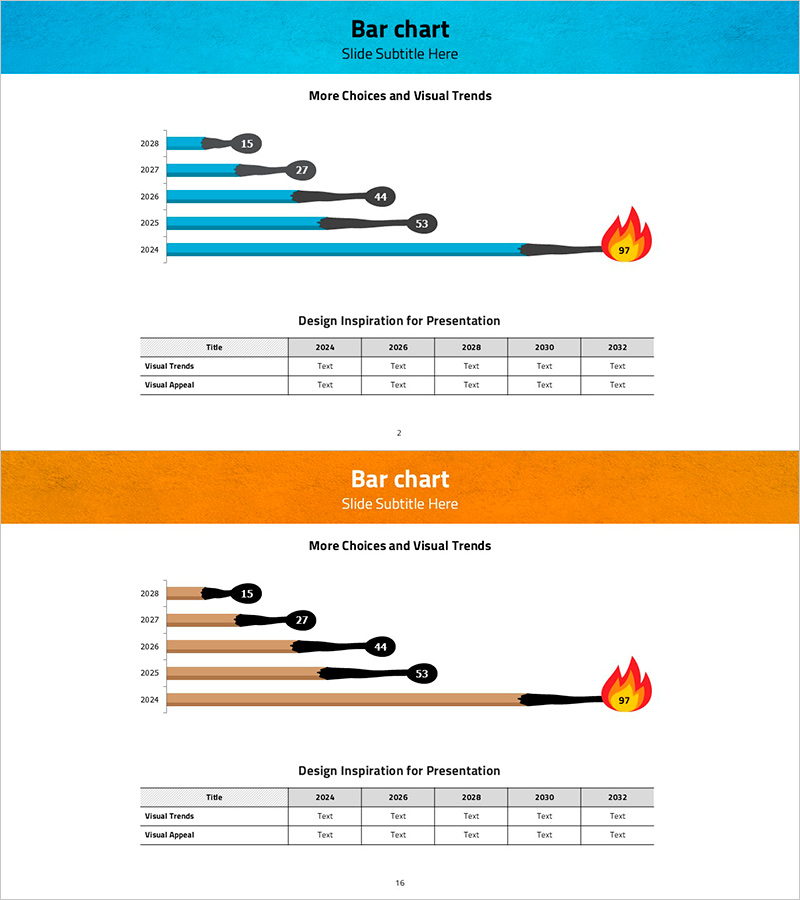
A distinctive horizontal bar chart PowerPoint slide featuring match stick illustrations as data point markers. This presentation template visualizes five years of performance data (2024–2028) with horizontal bars, each topped with a flame icon to emphasize achievement metrics. The first slide uses a turquoise background while the second employs an orange background, allowing flexible adaptation to different presentation contexts. Both slides include a summary table below the chart displaying visual trends and appeal ratings by year, enabling simultaneous presentation of quantitative and qualitative analysis. Delivered in 16:9 widescreen PPTX format with 2 fully editable slides.
Usage Points
-
Main Usage
Designed to compare year-over-year performance metrics or market size evolution through visual representation. The match flame icon symbolically conveys growth, achievement, and momentum, while the five data points enable quick assessment of upward or downward trends at a glance.
-
How to Use
Apply to business performance reports (results analysis section), marketing plans (market size trends), or investor pitch decks (revenue growth rates). Select turquoise background to emphasize technology and trust, or orange to highlight energy and growth potential, matching your presentation tone.
-
Recommended For
Finance professionals, marketing managers, business executives, consultants, and data analysts presenting quantitative findings persuasively. Particularly effective when emphasizing positive performance shifts or market opportunities in formal presentations.
-
Slide Structure
Each slide comprises a header section (title and subtitle), central chart area (five horizontal bars with year labels, flame icons, and numeric values), and a footer table (five columns showing visual trends and appeal ratings). Bar length and icon placement clearly differentiate data magnitudes, while the table provides qualitative assessment alongside quantitative metrics.
Related Products
-

Management Performance Comparison Analysis Chart – Data-Driven Decision Making
#Business Strategy #Market and Competitor Analysis #Graph
-

Business Promotion Strategy Slide Template – Effective Market and Competitor Analysis
#Business Strategy #Market and Competitor Analysis #Graph
-

Shareholder Status Analysis with Pie Charts and Graphs
#Company Introduction #Market and Competitor Analysis #Diagram
-

Performance Analysis Pie Chart – Market Share Visualization
#Market and Competitor Analysis #Diagram #Graph
