Neuroscience Topic Analysis and Pie Charts – Market Share Visualization
RJ0500009_5
- Last Update 06/09/2025
- File Size 0.3MB
- # of Slides 3
- File Format PPTX
- Slide Ratio 16:9
- Color
Keywords
- #Content-Based Slides
- #Design-Based Slides
- #Market and Competitor Analysis
- #Diagram
- #Graph
- #Market Share
- #Market Analysis
- #Table
- #Circles
- #Standard Table
- #16:9
- #pie chart PowerPoint slide
- #pie graph template
- #ratio visualization slide
- #market share chart
- #data proportion presentation
- #2-segment pie chart
About the Product
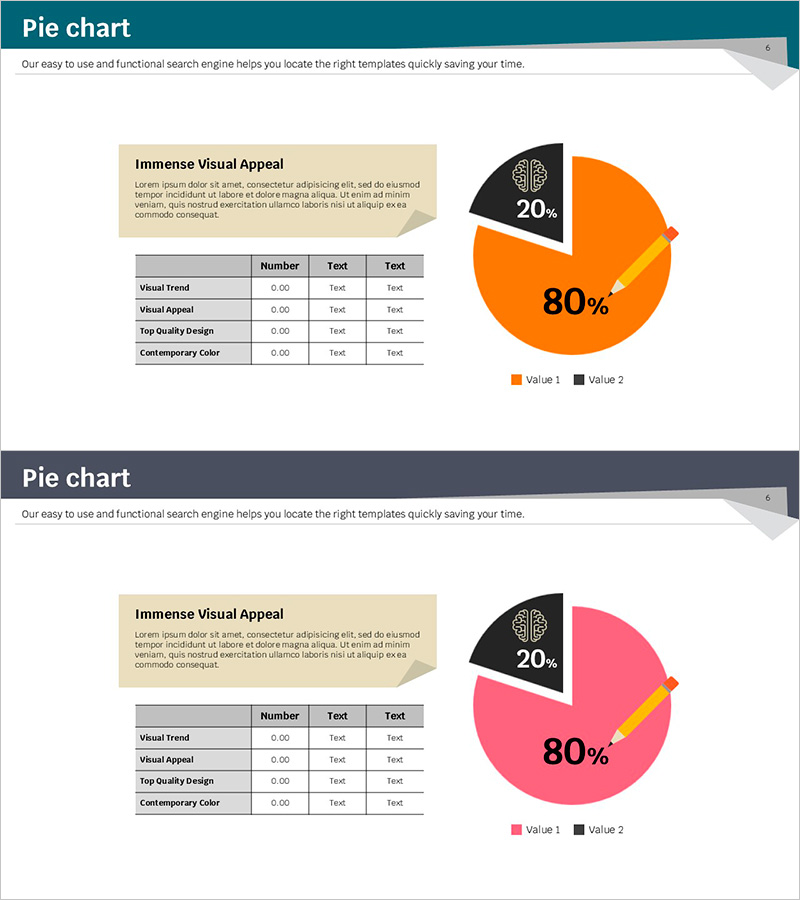
A professional PowerPoint slide set for visualizing ratio data such as market share, sales proportion, and customer composition. Available in two color versions—orange and pink—each slide features a 2-segment pie chart with 80% and 20% proportions, accompanied by descriptive text area and data table. Ideal for neuroscience, market analysis, and business presentations requiring clear numerical emphasis. Delivered in 16:9 widescreen format, 3-slide set, PPTX format compatible with all PowerPoint versions for immediate editing and customization.
Usage Points
-
Main Usage
Clearly visualize two-category ratio data including market share, sales proportion, customer composition, and neuroscience analysis metrics. The 80%-20% structure emphasizes primary and secondary segments, supporting data-driven decision-making in business reports, marketing analysis, and academic presentations.
-
How to Use
Double-click the pie chart values and legend to replace with your actual data. Enter analysis content in the left text box and detailed figures in the right data table. Select either orange or pink color version matching your brand or presentation theme, then customize all elements as needed.
-
Recommended For
Marketing professionals, data analysts, business executives, academic presenters, neuroscience researchers, market researchers, and finance teams communicating ratio-based data clearly and effectively.
-
Slide Structure
3-slide set: Slides 1-2 feature orange pie chart (80% orange segment, 20% black segment) with left descriptive text box and right 4-row data table / Slide 3 displays pink pie chart (80% pink, 20% black) with identical layout. 16:9 widescreen format, all elements fully editable.
Related Products
-

Modern Blue Pie Chart Template – Market Share Analysis
#Market and Competitor Analysis #Diagram #Graph
-

Performance Analysis Pie Chart – Market Share Visualization
#Market and Competitor Analysis #Diagram #Graph
-

Market Analysis Report Visualized with Pie Chart
#Market and Competitor Analysis #Diagram #Graph
-

Analyzing Market Share with 3 Donut Charts and Tables
#Market and Competitor Analysis #Diagram #Graph
