Visualizing Real Estate Sales Composition with Doughnut Chart – A Tool for Management Analysis
RJ0900012_29
- Last Update 08/19/2025
- File Size 0.2MB
- # of Slides 2
- File Format PPTX
- Slide Ratio 16:9
- Color
Keywords
- #Content-Based Slides
- #Design-Based Slides
- #Market and Competitor Analysis
- #Financial Plans and Performance
- #Graph
- #Market Share
- #Sales and Revenue
- #Circles
- #Doughnut Chart
- #16:9
- #doughnut chart PowerPoint
- #pie chart slide template
- #ratio visualization presentation
- #donut graph slides
- #real estate sales analysis PPT
- #how to create doughnut chart in PowerPoint
About the Product
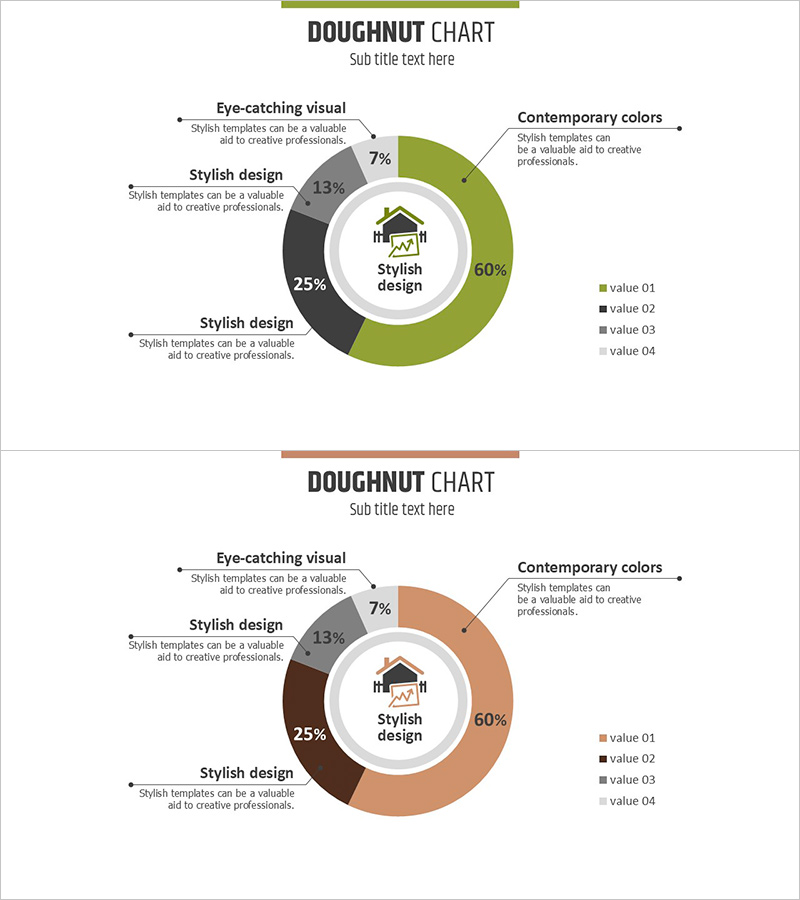
A 2-slide PowerPoint presentation featuring doughnut charts for visualizing real estate sales composition, market share, and management analysis data. Two color versions are provided: green and brown palettes. Each slide includes a central icon area, four data segments with percentage values, and surrounding descriptive text labels. Optimized for 16:9 widescreen format in PPTX, fully editable and ready to use. Perfect for real estate, finance, and business presentations to communicate composition ratios intuitively.
Usage Points
-
Main Usage
Communicate sales composition, market share, and management metrics using four-segment doughnut charts to executives, investors, and stakeholders. The central icon emphasizes the topic while surrounding text labels clarify each segment's meaning and percentage value.
-
How to Use
Insert into company profile presentations, business plans, investor pitch decks, and quarterly management reports—particularly in market analysis and financial sections. Edit segment values and labels to match your actual data, and adjust colors to align with corporate branding guidelines.
-
Recommended For
Business executives, marketing managers, management consultants, investment analysts, and financial professionals. Ideal for any presentation requiring ratio visualization: revenue breakdown, market share distribution, customer segmentation, cost allocation, or budget composition.
-
Slide Structure
2-slide set. Each slide features one doughnut chart with 4 segments, central icon placeholder, and surrounding text annotation areas. Green version uses lime, dark green, gray, and light gray; brown version uses light brown, dark brown, gray, and light gray.
Related Products
-

Comparing Three Types of Donut Charts – Market Share Analysis
#Market and Competitor Analysis #Financial Plans and Performance #Graph
-

Donut Chart for Beach Travel – Capture Visual Appeal
#Market and Competitor Analysis #Financial Plans and Performance #Graph
-

Car PowerPoint Template Wide - Donut Chart for Market Share Analysis
#Market and Competitor Analysis #Financial Plans and Performance #Graph
-

Beer Carbonated Doughnut Chart – Market Share Analysis
#Market and Competitor Analysis #Financial Plans and Performance #Graph
