Travel App Market Share and Customer Evaluation Donut Chart
RJ0600053_5
- Last Update 07/04/2025
- File Size 3.2MB
- # of Slides 2
- File Format PPTX
- Slide Ratio 16:9
- Color
Keywords
- #Content-Based Slides
- #Design-Based Slides
- #Market and Competitor Analysis
- #Graph
- #Customer Analysis
- #Market Share
- #Circles
- #Doughnut Chart
- #16:9
- #donut chart PowerPoint slide
- #pie chart template
- #market share visualization
- #data ratio slide
- #how to create donut chart in PowerPoint
- #travel app market analysis slide
About the Product
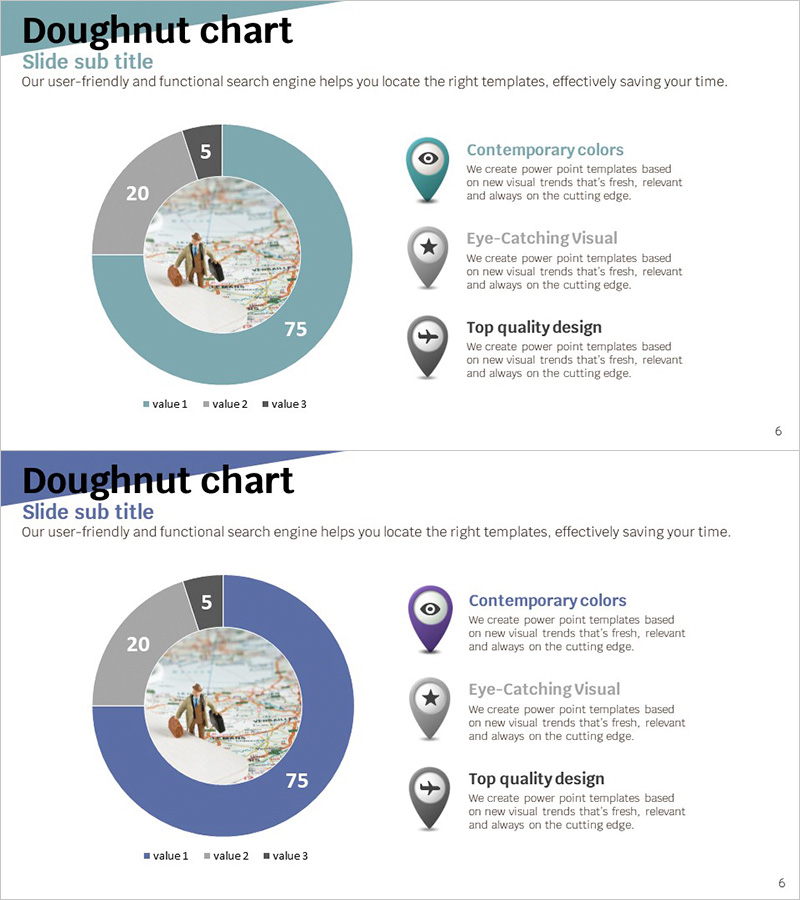
A donut chart PowerPoint slide template designed to visualize travel app market share and customer ratings. The open-center design allows you to insert images or key metrics in the middle, creating visual impact. Two color versions are provided: teal and navy tones. Each slide clearly represents the proportion of three data segments with supporting icons and text descriptions on the right side. This 16:9 widescreen 2-slide set is ready to use and fully editable for your presentation needs.
Usage Points
-
Main Usage
Effectively displays proportional data for 3-4 categories such as market share, sales distribution, or customer satisfaction ratings. The center opening accommodates images or key figures, while right-aligned icons with descriptions clarify each segment's meaning and enhance visual communication.
-
How to Use
Use in business presentations, market analysis reports, and product pitch decks to compare competitors or segment customer data. Double-click chart values and labels to edit numbers, and modify colors through the theme color palette. Fully compatible with PowerPoint 2016 and later versions.
-
Recommended For
Marketing managers, business analysts, product strategists, and sales professionals presenting market insights or customer preferences. Ideal for travel, tourism, app development, and retail industries during strategy meetings, investor pitches, and quarterly reviews.
-
Slide Structure
2-slide set with 16:9 widescreen format. Each slide features a 3-segment donut chart (example: 75%, 20%, 5%), a center circular image placeholder, and a right-side panel with 3 icon-based descriptions. Available in teal and navy color schemes.
Related Products
-

Causes of Stress for Office Workers – Visualized Donut Chart
#Market and Competitor Analysis #Graph #Customer Analysis
-

Donut Chart Slide Visualizing Marriage Survey Data
#Market and Competitor Analysis #Graph #Customer Analysis
-

Wedding Cost Analysis - Donut Chart Data Visualization
#Market and Competitor Analysis #Graph #Customer Analysis
-

Spotlight on Customer Segments – Market Share Network
#Market and Competitor Analysis #Graph #Customer Analysis
