Line Graph Visualizing Future Market Outlook for Sailing Travel
RJ0600072_17
- Last Update 07/09/2025
- File Size 0.3MB
- # of Slides 2
- File Format PPTX
- Slide Ratio 16:9
- Color
Keywords
- #Content-Based Slides
- #Design-Based Slides
- #Market and Competitor Analysis
- #Financial Plans and Performance
- #Graph
- #Future Outlook
- #Sales and Revenue
- #Line
- #Line Chart
- #16:9
- #line chart PowerPoint
- #line graph slide template
- #market trend visualization
- #dual-series data chart
- #time-series trend analysis slide
About the Product
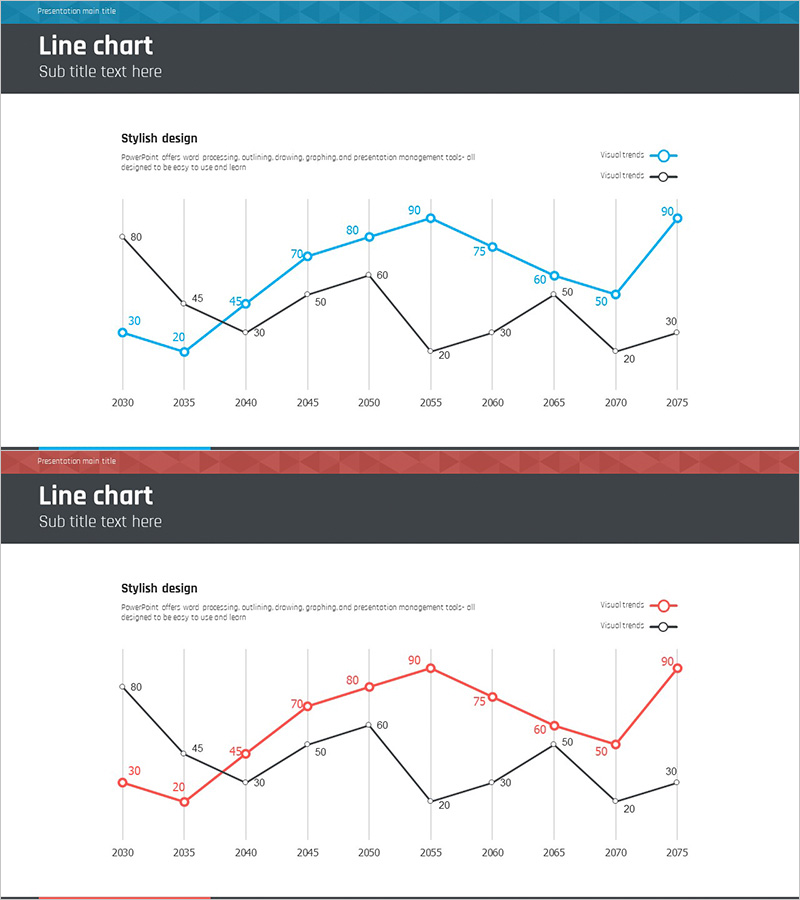
A PowerPoint line chart slide visualizing future market outlook for the sailing travel industry. Two data series are distinguished by blue and black lines, clearly displaying trend changes across 46 years from 2030 to 2075. Each data point includes numerical values for precise comparison, with a grid background ensuring easy readability. The 2-slide set offers two color theme options—blue and red—allowing you to match your presentation tone. This chart template is immediately applicable to all presentation scenarios requiring time-series trend visualization, including revenue trends, market growth rates, financial planning, and performance analysis.
Usage Points
-
Main Usage
Optimized for comparing and visualizing changes in two or more data series over time. Effectively communicates long-term trends in revenue, market growth rates, customer satisfaction changes, and financial metrics to stakeholders.
-
How to Use
Replace the displayed data points and numerical values with your actual data. The blue theme conveys trust and positivity, while the red theme emphasizes urgency or critical situations. The grid background facilitates easy number reading, making it ready for insertion into financial reports, market analysis presentations, and business plan documents.
-
Recommended For
Recommended for finance and marketing teams presenting quarterly or annual performance reports, investor pitches on market outlook, business plan presentations explaining growth trajectories, consulting firms analyzing market trends, and travel and tourism industry professionals presenting market dynamics.
-
Slide Structure
2-slide set. Each slide displays two data series (blue and black lines) representing 46 years of data from 2030 to 2075. X-axis shows years at 5-year intervals (2030, 2035, 2040, 2045, 2050, 2055, 2060, 2065, 2070, 2075). Y-axis ranges from 0 to 90. Precise numerical values appear at each data point, with a legend distinguishing the two series.
Related Products
-

Simple Car Wide Presentation Line Chart – Market and Competitive Analysis
#Market and Competitor Analysis #Financial Plans and Performance #Graph
-

Origami Presentation Template Section Line Graph – Market and Performance Analysis
#Market and Competitor Analysis #Financial Plans and Performance #Graph
-

Market Trends with Key Focus Areas
#Market and Competitor Analysis #Financial Plans and Performance #Graph
-

Comparison Graph by Transportation Industry – Market Analysis and Financial Performance
#Market and Competitor Analysis #Financial Plans and Performance #Graph
