Arctic Business Market Status Pyramid Chart
RJ0600040_9
- Last Update 07/01/2025
- File Size 0.3MB
- # of Slides 2
- File Format PPTX
- Slide Ratio 16:9
- Color
Keywords
About the Product
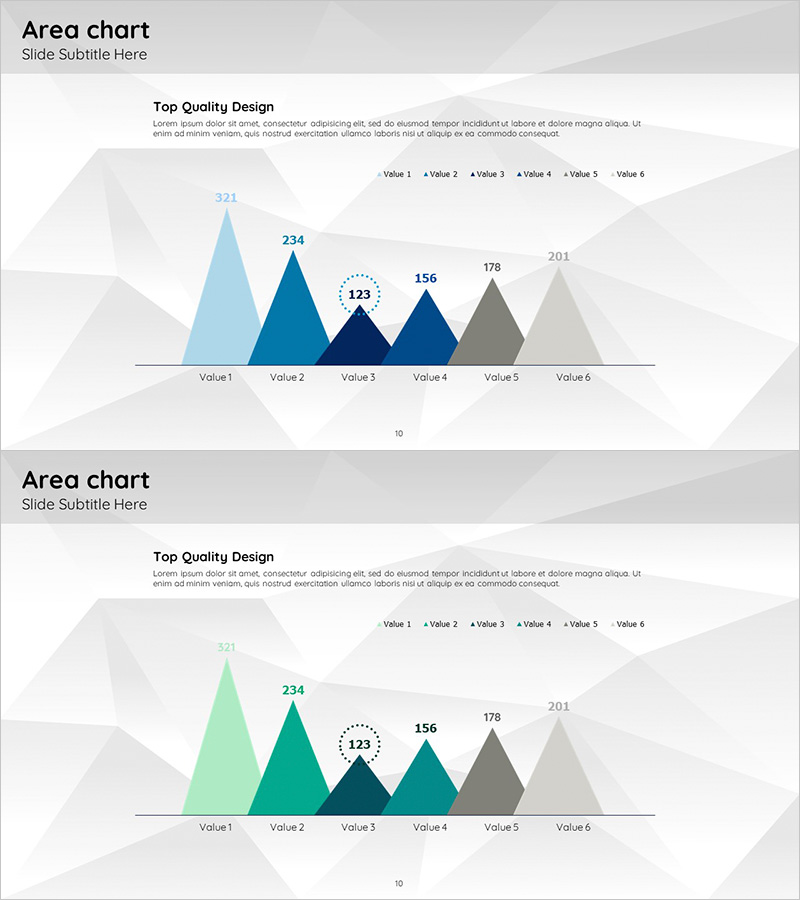
This free PowerPoint slide features an area-based pyramid chart that compares six data points in a hierarchical structure. Perfect for visualizing market status, sales volume, customer distribution, and competitive analysis, this slide requires only text and number replacements for immediate use. The minimalist design with blue-to-gray gradient tones creates a professional presentation suitable for business plans, investor pitches, quarterly reports, and market analysis decks. Download and customize this slide template at no cost.
Usage Points
-
Main Usage
Visualizes six data points in a hierarchical pyramid format to compare market status, sales volume, customer segments, market share, and competitive positioning.
-
How to Use
Replace Value 1–6 labels and corresponding numbers with your own data. Adjust axis labels to reflect your metrics (e.g., 'Sales Volume', 'Market Share'). Modify colors if needed to match your brand guidelines.
-
Recommended For
Business plan market analysis sections, investor pitch deck competitive analysis, quarterly report performance comparisons, product sales performance presentations, and strategic planning documents.
-
Slide Structure
Single-slide design featuring one area pyramid chart with six data series (Value 1–6) and corresponding value labels. Includes title and description text area at the top for context and clarity.
Related Products
-

Competitive Advantage Bar General Graph – Emphasizing Performance through Market Analysis
#Free Graphs
-

Tree Yellow Purple Area Chart – Innovation in Data Visualization
#Free Graphs
-

Vertical Bar Chart for Data Analysis – Business Insights
#Free Graphs
-

Market Analysis by Year Horizontal Bar Graph
#Free Graphs
