Arctic Market Future Outlook Bar Chart
RJ0600040_17
- Last Update 07/01/2025
- File Size 0.6MB
- # of Slides 2
- File Format PPTX
- Slide Ratio 16:9
- Color
Keywords
- #Content-Based Slides
- #Design-Based Slides
- #Business Strategy
- #Market and Competitor Analysis
- #Diagram
- #Graph
- #Achievements
- #Market Analysis
- #Table
- #Horizontal Bar
- #Horizontal Bar Chart
- #16:9
- #horizontal bar chart PowerPoint
- #market analysis presentation slide
- #5-year trend chart
- #data comparison graph
- #business strategy PowerPoint template
About the Product
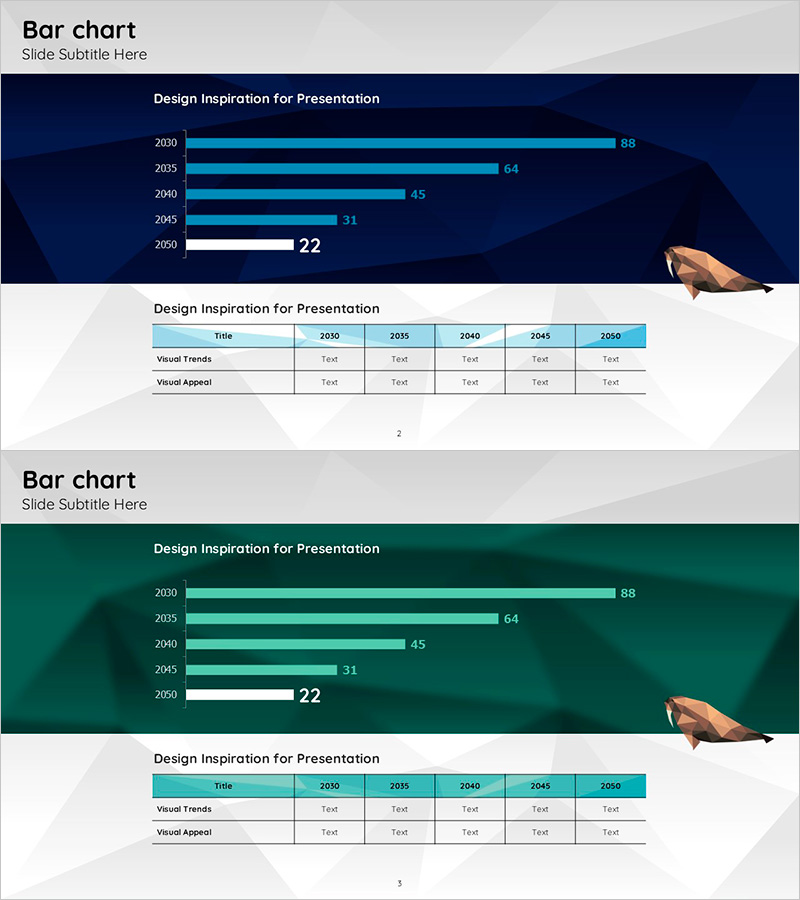
A professional PowerPoint slide featuring a horizontal bar chart displaying market growth trends from 2030 to 2050 across five data points (88, 64, 45, 31, 22). The design uses a dark navy background with cyan-colored bars for clear numerical visualization and high contrast visibility. The two-slide layout includes a graph section on top and a corresponding data table below, enabling comprehensive information delivery. Ideal for market analysis presentations, business strategy discussions, and future outlook reports in corporate settings.
Usage Points
-
Main Usage
Visualizes year-over-year market size, sales volume, or growth rate comparisons using horizontal bar charts. The five-year timeline allows stakeholders to quickly assess market performance trends and make data-driven decisions for business planning and strategic forecasting.
-
How to Use
Replace the sample data values (88, 64, 45, 31, 22) with your actual market figures. The bar lengths automatically adjust proportionally. Update the data table below with detailed metrics and supporting information. The dark navy background provides excellent contrast for large conference room presentations and projector displays.
-
Recommended For
Executive briefings, investor pitch meetings, market analysis reports, and business planning sessions. Particularly valuable for finance, consulting, manufacturing, and retail sectors where data-driven decision-making is critical. Also suitable for employee training and quarterly performance reviews.
-
Slide Structure
Slide 1: Title area + horizontal bar chart with 5 years (2030–2050) + numerical value labels. Slide 2: Title area + data table with 6 columns (Title, 2030, 2035, 2040, 2045, 2050) and 3 rows (Visual Trends, Visual Appeal, etc.). Full 16:9 widescreen format in PPTX.
Related Products
-

Top Sales Analysis Graph – Visualizing Market and Performance
#Market and Competitor Analysis #Financial Plans and Performance #Diagram
-

Match Illustration Bar Chart – Performance and Market Analysis
#Business Strategy #Market and Competitor Analysis #Diagram
-

Future Outlook & Competitor Analysis Chart
#Company Introduction #Market and Competitor Analysis #Diagram
-

Competitor and Customer Analysis Horizontal Bar Graph and Table
#Market and Competitor Analysis #Diagram #Graph
