Introduction to Penguin Key Financial Indicators – Blue Green Diagram
RJ0600040_15
- Last Update 07/01/2025
- File Size 1.1MB
- # of Slides 2
- File Format PPTX
- Slide Ratio 16:9
- Color
Keywords
About the Product
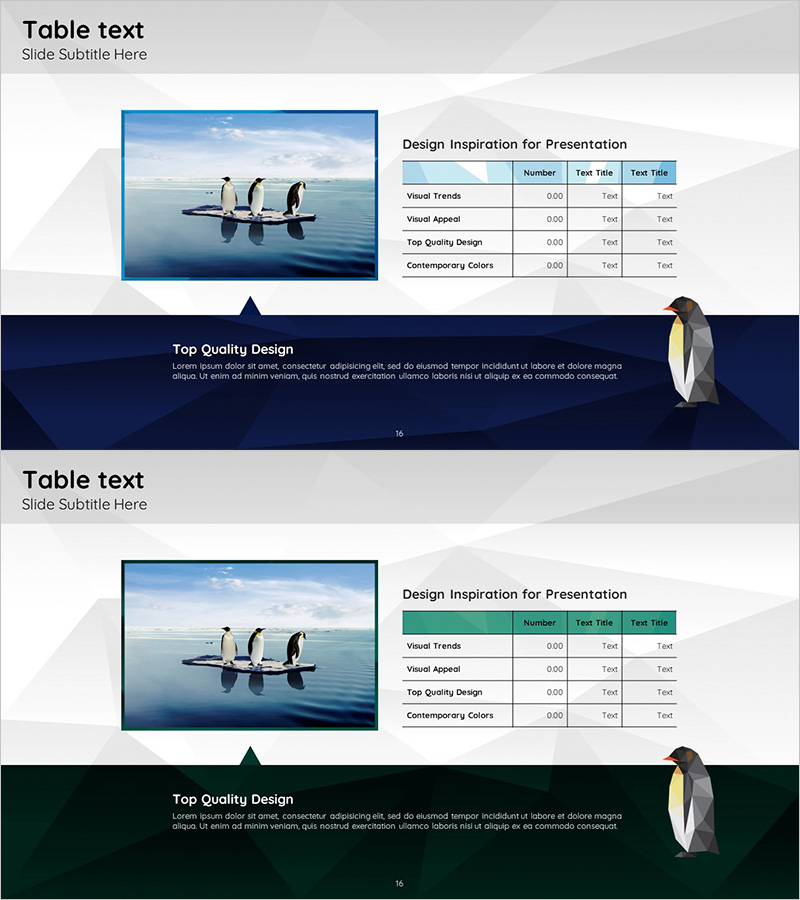
A teal-themed PowerPoint slide featuring penguin imagery with a dual-layout design combining a high-resolution image area on the left and a structured financial data table on the right. The table is organized in a 4-row, 3-column format with Number and Text Title columns, ensuring both visual appeal and numerical clarity. A dark navy footer section emphasizes key messages and insights. This 2-slide set is ideal for investor presentations, corporate introductions, financial reports, and business performance briefings where visual credibility and data accuracy are essential.
Usage Points
-
Main Usage
This slide effectively communicates key financial metrics through both visual imagery and structured numerical data. Designed for investor pitches, stakeholder briefings, and corporate presentations, it builds financial credibility while making complex data accessible and memorable.
-
How to Use
Insert a corporate image, product photo, or facility picture in the left image area. Populate the right table with critical financial metrics such as revenue, operating profit, ROI, and growth rate. Complete the slide by adding a concise financial summary or forward-looking statement in the navy footer section.
-
Recommended For
Ideal for investor relations materials, pitch decks, corporate introductions, annual reports, financial performance reviews, and board presentations. Recommended for CFOs, finance directors, investor relations teams, and executive leadership presenting financial results to external stakeholders.
-
Slide Structure
The slide comprises three distinct sections: a title area at the top left, a large image placeholder occupying approximately 40% width on the left side, a 4-row by 3-column financial data table on the right, and a dark navy footer with explanatory text. The 2-slide format allows for progressive disclosure of financial information across multiple metrics.
Related Products
-

Environmental Protection Expected Return on Investment Table – Finance Planning and Performance
#Financial Plans and Performance #Diagram #Key Financial Indicators
-

Table Chart and Descriptive Text – Visualizing Sales Metrics
#Financial Plans and Performance #Diagram #Sales and Revenue
-

Farm Key Financial Indicators Table Chart – Intuitive Presentation of Financial Performance
#Financial Plans and Performance #Diagram #Sales and Revenue
-

Robot Business Revenue and Sales Analysis Table – A Systematic Approach to Financial Planning
#Financial Plans and Performance #Diagram #Income Statement
