Environmental Protection Expected Return on Investment Table – Finance Planning and Performance
RJ0600015_7
- Last Update 06/24/2025
- File Size 2.7MB
- # of Slides 2
- File Format PPTX
- Slide Ratio 16:9
- Color
Keywords
About the Product
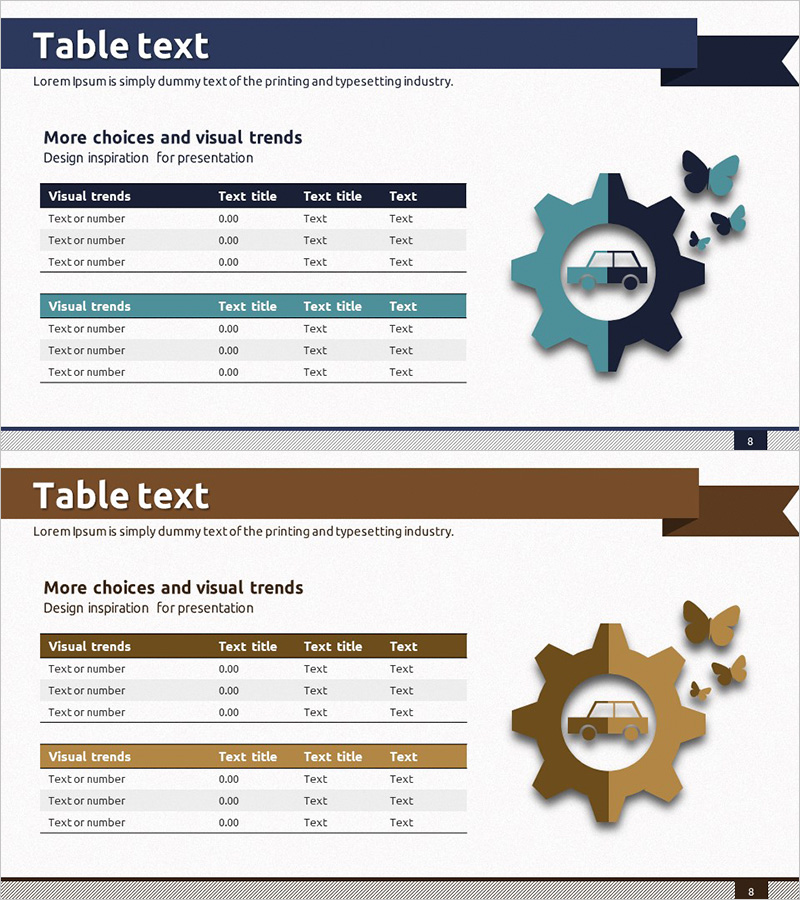
A 2-slide PowerPoint presentation template featuring data tables for financial planning and performance analysis. The slides use dark navy and teal header backgrounds with white text, creating clear contrast for effective numerical data visualization. Each table contains 4 columns and 3 rows, structured to display text, numbers, and percentage information for comparing investment returns, cost items, and performance indicators. Decorative gear and butterfly icons positioned on the right side reinforce business process and environmental protection themes. Optimized for 16:9 widescreen format and delivered as fully editable PPTX files.
Usage Points
-
Main Usage
Presents quantitative financial data—planning figures, performance metrics, and ROI comparisons—in a structured tabular format. Designed for executive reports, financial analysis presentations, and business plan documents where multiple metrics require simultaneous comparison to support decision-making.
-
How to Use
Double-click table cells to edit text and numerical values directly. Maintain header colors (dark navy and teal) while adjusting data row background colors as needed. The decorative gear and butterfly icons are independent objects that can be moved, resized, deleted, or recolored to match your presentation theme.
-
Recommended For
CFOs and finance professionals presenting quarterly or annual performance reports; investor relations presentations requiring financial status sections; business plans showing projected revenue and cost analysis; environmental and ESG project materials demonstrating investment impact and ROI analysis.
-
Slide Structure
Two-slide set. Each slide features a colored header (dark navy or teal background with white text) and a data section (4 columns × 3 rows). The first slide uses a dark navy header while the second uses teal, providing visual variety. Decorative gear and butterfly icons on the right symbolize business processes and environmental themes.
Related Products
-

Modern City Theme Income Statement Table – Visual Financial Analysis
#Financial Plans and Performance #Diagram #Income Statement
-

Income Statement Table for Financial Visualization – Distinct Data Analysis
#Financial Plans and Performance #Diagram #Income Statement
-

Table Chart and Descriptive Text – Visualizing Sales Metrics
#Financial Plans and Performance #Diagram #Sales and Revenue
-

Business Goal Setting Table – The First Step in Business Strategy Development
#Business Vision and Strategy #Financial Plans and Performance #Diagram
