Arctic Business Competitor Analysis Pyramid Chart
RJ0600040_12
- Last Update 07/01/2025
- File Size 0.4MB
- # of Slides 2
- File Format PPTX
- Slide Ratio 16:9
- Color
Keywords
About the Product
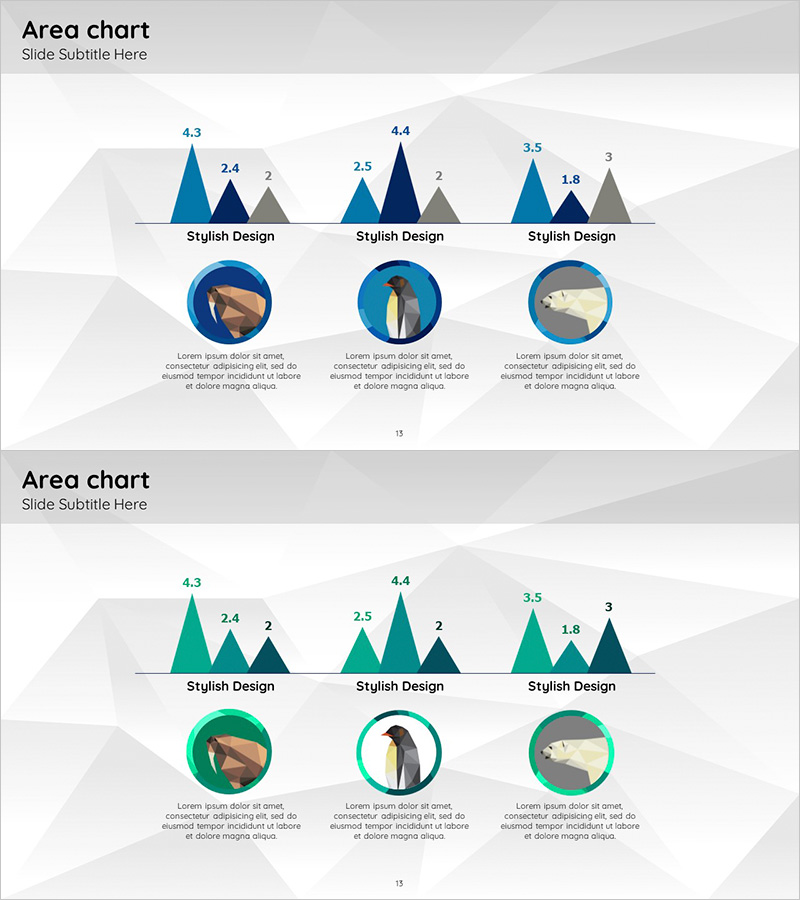
A PowerPoint slide featuring a pyramid chart designed for competitor analysis and market positioning. The 3-tier hierarchical structure visualizes competitive advantages with a stable blue and gray color palette that reinforces corporate credibility. Each tier includes numeric input fields and circular image frames for immediate data integration. Ideal for business presentations, pitch decks, and investor relations materials to clearly communicate market positioning. Provided in 16:9 widescreen PPTX format with fully editable text, numbers, and image placeholders.
Usage Points
-
Main Usage
Visualize competitor analysis data in a hierarchical pyramid structure to clearly express competitive positioning within the market. Numeric input fields on each tier support quantitative comparative analysis, effectively communicating competitive strength to investors and business partners.
-
How to Use
Enter competitor names, market share percentages, and core competencies into each pyramid tier. Insert competitor logos or representative images into the circular frames and update numeric labels with your data. Customize colors and fonts to match your corporate brand guidelines.
-
Recommended For
Ideal for business plans, investor pitch decks, executive reports, and marketing strategy presentations. Particularly valuable for startups, SMEs, and consulting firms presenting market entry strategies and competitive positioning.
-
Slide Structure
2-slide set featuring a blue-tone pyramid chart (3-tier hierarchy with numeric labels) and a gray-tone pyramid chart (identical structure, color variation). Each slide includes 3 circular image frames and text input areas positioned for easy data entry.
Related Products
-

Sports Future Expected Effects and Numerical Graphs
#Market and Competitor Analysis #Graph #Other
-

Sports Vertical Bar Chart – The Perfect Choice for Performance Analysis
#Business Strategy #Market and Competitor Analysis #Graph
-

Pencil Horizontal Chart Competitive Advantage - Visualizing Market Status
#Market and Competitor Analysis #Graph #Other
-

Key Performance Analysis Table – Achievements at a Glance
#Company Introduction #Market and Competitor Analysis #Diagram
