Visualizing Data with 3 Simple Pie Charts – A Stylish Presentation Method
RJ0600039_9
- Last Update 07/01/2025
- File Size 2.8MB
- # of Slides 2
- File Format PPTX
- Slide Ratio 16:9
- Color
Keywords
About the Product
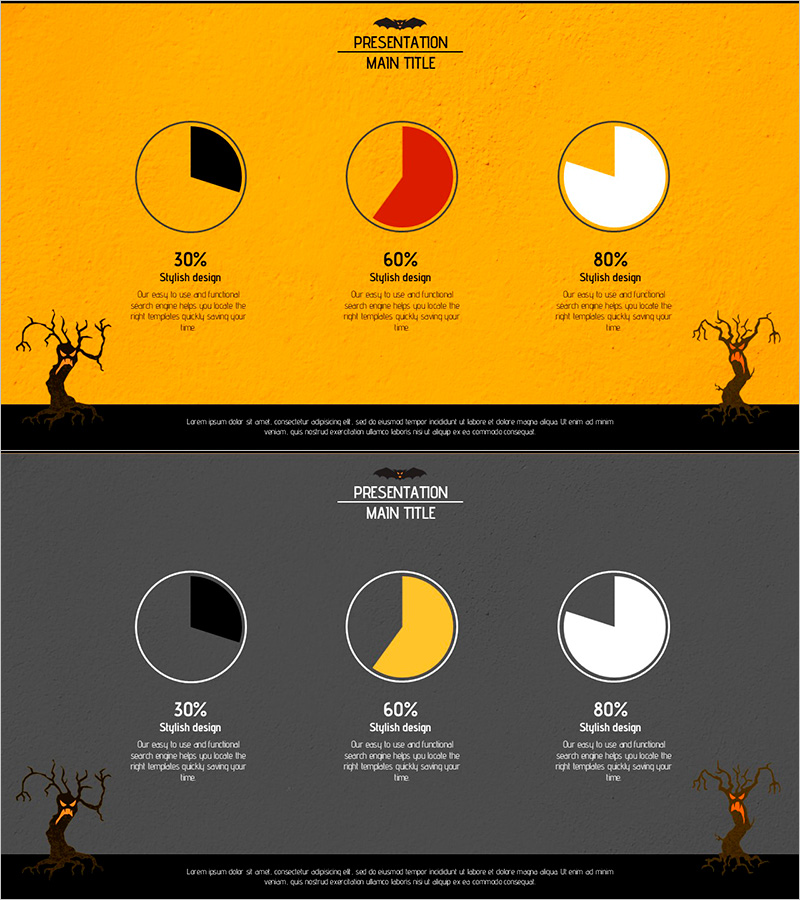
A PowerPoint slide featuring three pie charts to clearly present ratio data with visual impact. The design uses an orange background with black, red, and white segments to create strong contrast, allowing viewers to compare multiple percentage distributions (30% / 60% / 80%) at a glance. The 2-slide set includes background variations in orange and gray tones, formatted in 16:9 widescreen with dedicated text description areas beneath each chart. Immediately applicable to presentations, reports, and business proposals for visualizing composition ratios, market share, performance analysis, and comparative metrics.
Usage Points
-
Main Usage
Enables simultaneous comparison and analysis of multiple ratio datasets on a single slide. Ideal for presenting market share, budget allocation, performance composition, customer satisfaction scores, and other percentage-based information across up to three categories, with dedicated text areas for numerical values and interpretation.
-
How to Use
Edit each pie chart's segment percentages to input your actual data. Add item names, percentages, and descriptions in the text boxes below each chart. Customize colors as needed to highlight key segments. Choose between orange or gray background versions to match your presentation's overall tone and style.
-
Recommended For
Suitable for executives, marketing teams, finance departments, and planning teams. Effective for quarterly business reports, performance analysis presentations, marketing campaign results, budget status updates, customer segmentation analysis, and any data-driven presentation requiring clear ratio comparison.
-
Slide Structure
2-slide set with 3 pie charts arranged horizontally on each slide. Each chart (approximately 100px diameter) is positioned with percentage labels and text description areas (approximately 3 lines) directly below. Slide 1 features orange background with black, red, and white segments; Slide 2 offers gray background with black, orange, and white segments for design flexibility.
Related Products
-

Graph of Price Changes Due to Inflation – Essential Template for Economic Analysis
#Graph
-

Triangular Pattern Column Chart – Visualizing Key Achievements
#Company Introduction #Product/Service Introduction #Graph
-

Striking Performance Gap in Agricultural Outcomes
#Business Strategy #Financial Plans and Performance #Graph
-

Business Forest Wide Template Vertical Bar Chart – Visualizing Business Strategy
#Business Strategy #Graph #Column
