Competitive Bidirectional Bar Graphs – Effective Data Visualization
RJ0600039_30
- Last Update 07/01/2025
- File Size 2.7MB
- # of Slides 2
- File Format PPTX
- Slide Ratio 16:9
- Color
Keywords
About the Product
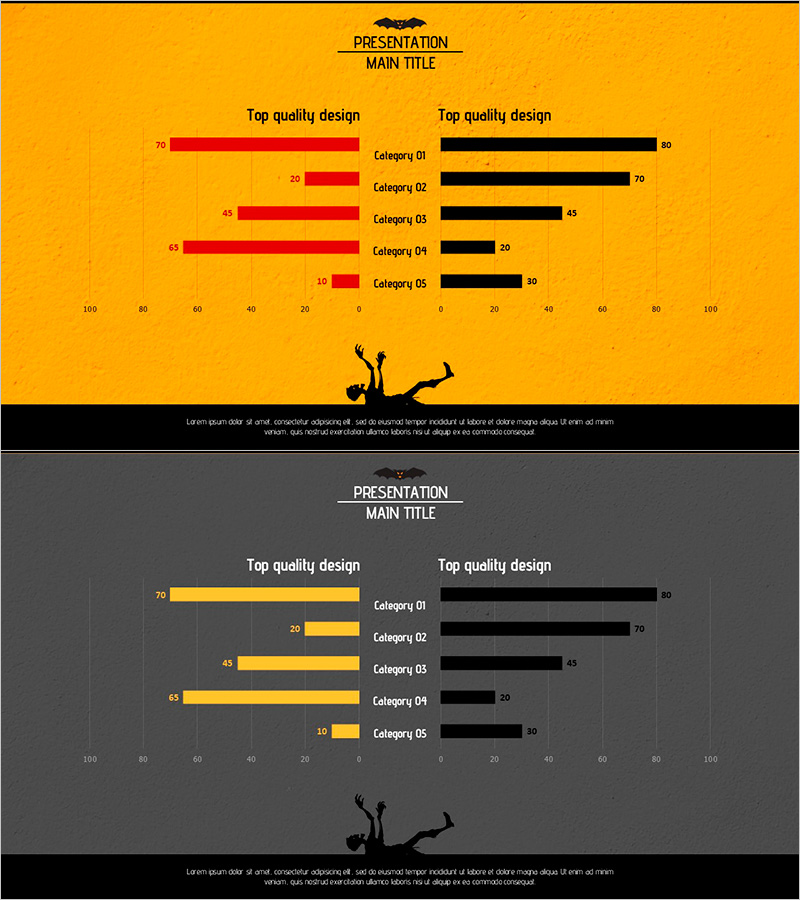
A bidirectional bar graph PowerPoint slide featuring a symmetrical left-right structure for comparing two data groups. The design uses contrasting orange and black color schemes to clearly distinguish between competing datasets across five categories. Ideal for competitive analysis, market share comparison, and pros-cons visualization in business presentations. This 16:9 widescreen 2-slide set is ready to edit and customize with your own data for immediate use.
Usage Points
-
Main Usage
Visualizes contrasting data from two groups using a symmetrical left-right structure to clearly express competitive relationships, comparative analysis, and pros-cons evaluations. The strong color contrast between orange and black directs audience attention and enables intuitive understanding of data differences.
-
How to Use
Use in executive reports, marketing strategy presentations, competitive analysis documents, and market research result briefings when comparing numerical values between two entities. Edit the slide values and category labels to match your specific data and customize the presentation for your audience.
-
Recommended For
Marketing managers, business analysts, sales executives, management consultants, and market research professionals who need to present data-driven comparisons. Particularly valuable for competitive landscape analysis, performance benchmarking, and option evaluation presentations.
-
Slide Structure
Consists of 2 slides, each featuring a symmetrical bidirectional bar graph with five orange bars on the left and five black bars on the right. Numerical labels appear beside each bar, with category labels (Category 01-05) positioned at the top. The background is divided into orange and gray sections for enhanced visual clarity.
Related Products
-

User Analysis Graph by Age Group – Advanced Data Insights
#Market and Competitor Analysis #Diagram #Graph
-

Camera Bar Graph Paired – Market Analysis and Competitive Edge
#Market and Competitor Analysis #Graph #Market Analysis
-

Successful Business Analysis Graph – Market and Competitor Analysis
#Market and Competitor Analysis #Graph #Competitor Analysis
-

Changing Perceptions about Parental Support – Market Trend Analysis
#Market and Competitor Analysis #Graph #Customer Analysis
