Red-Yellow Segmentation Chart – Overview of Visual Trends
RJ0600039_27
- Last Update 07/01/2025
- File Size 2.7MB
- # of Slides 2
- File Format PPTX
- Slide Ratio 16:9
- Color
Keywords
About the Product
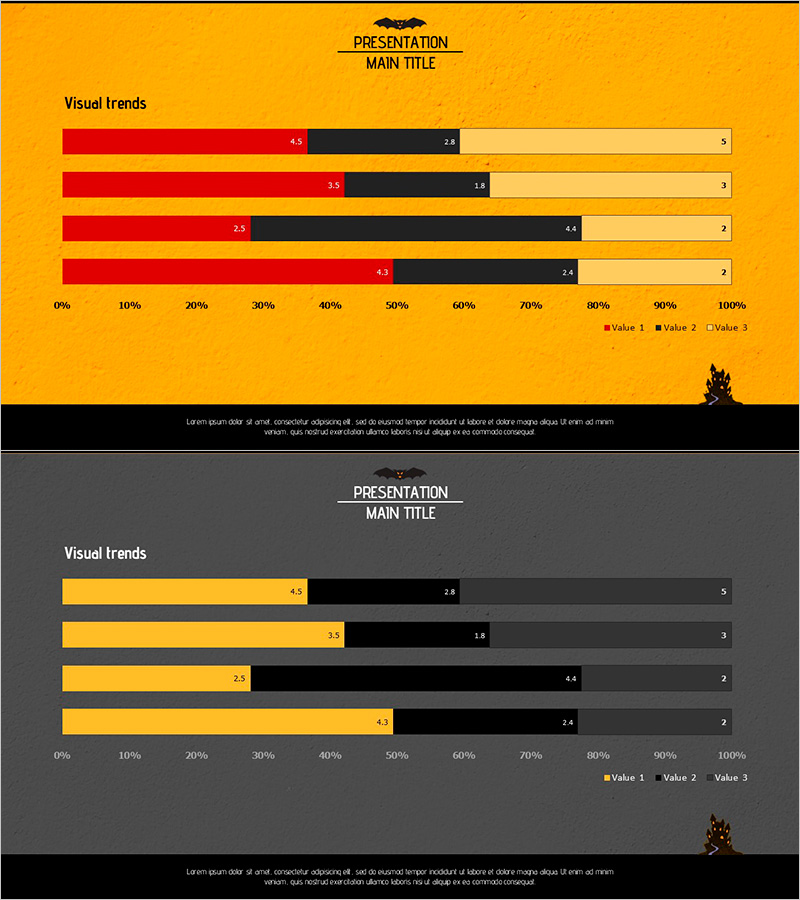
A horizontal stacked bar chart PowerPoint slide designed for visual trend analysis and data comparison. This presentation template features four color-coded segments—red, yellow, black, and beige—displaying three data values per row across four rows. The 2-slide set includes both light background (golden yellow) and dark background (charcoal gray) versions, allowing you to match your presentation environment. Ideal for marketing analysis, market research reports, and business presentations requiring multi-category ratio visualization and data-driven insights.
Usage Points
-
Main Usage
Visualize and compare numerical ratios across multiple categories in marketing analysis, market research, and business reports. The stacked bar chart format effectively shows the relationship between parts and the whole, making it easy for audiences to understand proportional data distribution across four distinct stages.
-
How to Use
Double-click the numerical values on the slide to replace them with your actual data. The color scheme—red, yellow, black, and beige—remains consistent across all rows, helping your audience easily distinguish between categories. Choose between the light background version (golden yellow) or dark background version (charcoal gray) based on your presentation venue and screen setup.
-
Recommended For
Marketing professionals, data analysts, business executives, market research specialists, and consulting presenters explaining trend analysis, customer segmentation, sales performance, market share, and competitive positioning. Suitable for C-level reports, investor presentations, and analytical business meetings.
-
Slide Structure
Horizontal stacked bar chart with 4 rows, each divided into 3 color-coded segments (Value 1, Value 2, Value 3). A 0%–100% horizontal axis with numerical labels for each segment. Two-slide template: identical chart structure on light background (golden yellow) and dark background (charcoal gray) for flexible presentation environment selection.
Related Products
-

Social Network Market Competitor Analysis PPT – Data Driven Competitive Advantage
#Market and Competitor Analysis #Diagram #Graph
-

Line Graph Market Research by Year – Market Trend Analysis
#Market and Competitor Analysis #Graph #Future Outlook
-

Acupuncture Effect Analysis Graph - Healing and Recovery
#Product/Service Introduction #Graph #Development Status
-

Ticket Sales Graph – Visualizing Competitive Edge
#Market and Competitor Analysis #Graph #Competitor Analysis
