Halloween Red Yellow Line Chart – Graph for Market Analysis
RJ0600039_26
- Last Update 07/01/2025
- File Size 2.7MB
- # of Slides 2
- File Format PPTX
- Slide Ratio 16:9
- Color
Keywords
About the Product
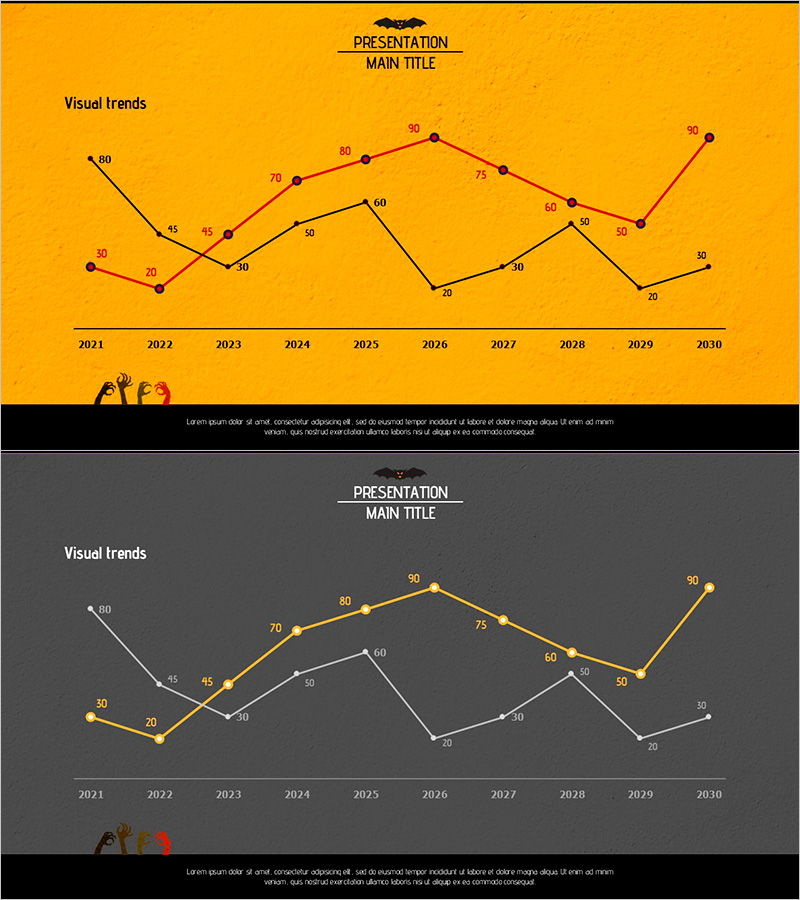
A multi-line chart PowerPoint slide designed for market analysis and competitive advantage strategy presentations. Set against an orange background with three distinct data lines in red, yellow, and black, this slide visualizes 10-year trends from 2021 to 2030 with clear numerical labels at each data point. The layout separates the chart area from text input zones, making it easy to add insights and explanations. Perfect for business reports, market analysis decks, and strategic presentations requiring comparative trend visualization.
Usage Points
-
Main Usage
Visualizes multiple data series over extended periods, such as market trends, competitor performance comparison, and revenue growth trajectories. The intersecting lines and directional patterns enable quick identification of performance gaps and strategic opportunities.
-
How to Use
Use in market analysis or competitive positioning sections to display competitor benchmarking, market share evolution, customer satisfaction trends, or sales performance over time. Simply edit the data labels and values to match your actual metrics for immediate presentation use.
-
Recommended For
Recommended for marketing managers, business strategists, sales executives, and C-level presentations requiring quantitative evidence. Ideal for investor pitches, quarterly business reviews, and strategic planning sessions.
-
Slide Structure
Title area at the top, central multi-line chart with 10-year timeline (2021–2030) on the X-axis, and descriptive text zone at the bottom. Three color-coded lines represent different data series, with numerical labels displayed at each data point for precise value reference.
Related Products
-

The Population Graph of Animals and Plants – Visualizing Competitive Advantage
#Business Strategy #Market and Competitor Analysis #Diagram
-

Data Comparison: Then vs. Now – Performance and Competitive Edge
#Business Strategy #Market and Competitor Analysis #Graph
-

Photo App Market Overview – Analyzing Competitive Advantages with Graphs
#Business Strategy #Market and Competitor Analysis #Graph
-

Analysis of Climbing Success Rate with Doughnut Chart
#Business Strategy #Market and Competitor Analysis #Graph
