Doughnut Chart for Product and Service Share Analysis
RJ0400008_14
- Last Update 05/18/2025
- File Size 2.1MB
- # of Slides 2
- File Format PPTX
- Slide Ratio 16:9
- Color
Keywords
- #Content-Based Slides
- #Design-Based Slides
- #Market and Competitor Analysis
- #Graph
- #Market Share
- #Market Overview
- #Circles
- #Doughnut Chart
- #16:9
- #doughnut chart PowerPoint
- #pie chart slide template
- #percentage analysis presentation
- #market share visualization
- #business analytics slide
- #data visualization PPT
About the Product
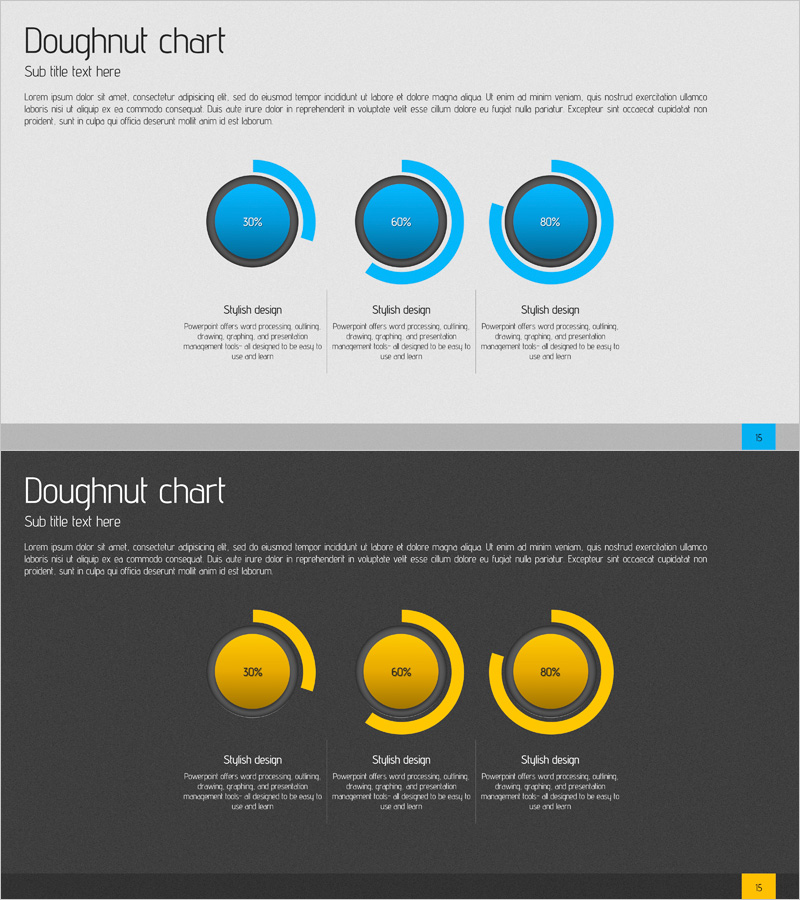
A professional doughnut chart PowerPoint slide designed for product and service share analysis and market segmentation visualization. Three doughnut graphs display 30%, 60%, and 80% percentages respectively, available in both blue and yellow color schemes. Each chart includes a descriptive text area below for detailed product, service, or market segment information. Delivered as a 2-slide 16:9 widescreen presentation template, ready for immediate use in business reports, marketing plans, market analysis presentations, and investor pitches.
Usage Points
-
Main Usage
Visualize product portfolio distribution, service mix analysis, and market segment share comparisons. Each doughnut chart represents an independent data series, allowing simultaneous presentation of three category percentages. Ideal for executive briefings, investor presentations, and strategic marketing communications.
-
How to Use
Edit the percentage values and descriptive text below each doughnut chart with your own data. Use the blue version for corporate and technology topics, yellow version for marketing and growth initiatives. Customize colors and percentages to create additional slides, and combine with other chart types to build comprehensive analytical presentations.
-
Recommended For
Marketing managers, business planners, financial analysts, and executives presenting market analysis, revenue composition, and customer segmentation. Recommended for startup investor pitches, quarterly earnings presentations, new product launch strategies, and competitive market positioning reports.
-
Slide Structure
Two-slide presentation with three doughnut charts arranged horizontally on each slide. First slide features light gray background with blue doughnut charts; second slide uses dark gray background with yellow doughnut charts. Each chart displays percentage value at center, arc-shaped progress indicator on outer ring, and descriptive text box below for annotations.
Related Products
-

Donut Charts by Race Item – Market Share Analysis
#Market and Competitor Analysis #Graph #Market Share
-

Green Orange Market Share Visualization – Data-Driven Insights
#Market and Competitor Analysis #Graph #Other
-

Geometry PPT Template Wide Map & Doughnut Chart
#Market and Competitor Analysis #Graph #Other
-

Travel App Market Share and Customer Evaluation Donut Chart
#Market and Competitor Analysis #Graph #Customer Analysis
