Green-Blue Regional Chart Analysis – Market Status and Competitor Analysis
RJ0600036_9
- Last Update 06/30/2025
- File Size 0.3MB
- # of Slides 2
- File Format PPTX
- Slide Ratio 16:9
- Color
Keywords
- #Content-Based Slides
- #Design-Based Slides
- #Market and Competitor Analysis
- #Graph
- #Other
- #Market Status
- #Market Analysis
- #16:9
- #stacked area chart PowerPoint slide
- #market analysis presentation template
- #competitor analysis chart
- #2-layer area chart
- #market share visualization
- #green-blue data chart
About the Product
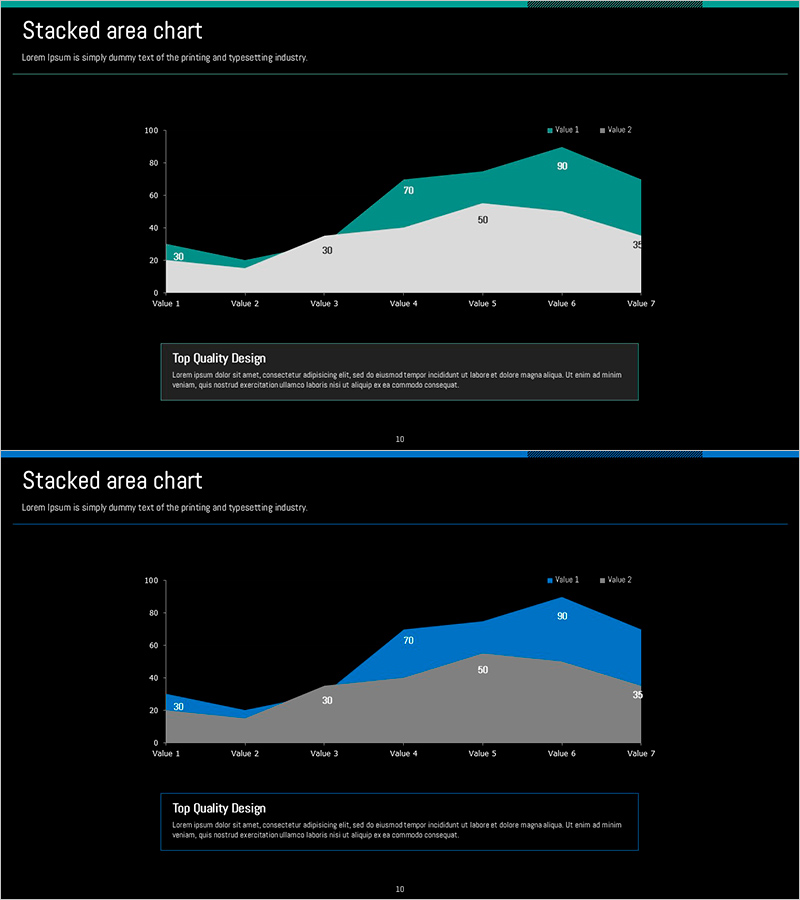
A stacked area chart PowerPoint slide designed for market status and competitor analysis presentations. The slide features two data layers in green and blue color schemes, effectively visualizing market share changes over time or comparative performance between competitors. Set against a dark background with clear numerical labels (30, 50, 70, 90), the chart spans 7 data points on the X-axis and ranges from 0 to 100 on the Y-axis. A text box at the bottom allows for additional analysis commentary. This layout is ideal for business plans, investor pitch decks, and marketing strategy presentations where data-driven decision-making is essential.
Usage Points
-
Main Usage
Visualizes market share trends, competitive performance comparisons, and data progression over time using a 2-layer stacked area structure. This chart simultaneously displays total market size and each competitor's relative position, making it highly effective for presenting market analysis insights and supporting strategic decision-making.
-
How to Use
Use this slide in the market analysis section of business plans, investor presentations, or marketing strategy documents to explain competitive landscape, market trends, and share evolution. Simply input your data and the chart updates automatically. The bottom text box accommodates detailed analysis findings or strategic implications.
-
Recommended For
Ideal for strategy planning teams, marketing departments, executives, and investor presentations. Particularly effective when demonstrating market size estimates, competitive positioning, and growth forecasts with numerical evidence. Suitable for consulting reports and business proposals.
-
Slide Structure
Comprises three sections: title area at top (Stacked area chart), central chart area with 2 data layers, 7 X-axis data points, 0-100 Y-axis scale, and numerical labels, and a text box at bottom for analysis input. Legend positioned in upper right corner clearly identifies each data layer.
Related Products
-

Wedding Preparation Progress Scale Slide – Visualization of Market Status
#Market and Competitor Analysis #Graph #Other
-

Triangular Prism Graph for Visualizing Market Status – Insights and Analysis
#Market and Competitor Analysis #Graph #Other
-

Triangular Pattern Presentation Template Area Chart – Market Analysis and Competitive Edge
#Market and Competitor Analysis #Graph #Other
-

Demand Analysis for Interior Furniture Presentation Slide
#Market and Competitor Analysis #Graph #Other
