Customer Share Analysis Chart – Insights for Successful Business
RJ0600036_7
- Last Update 06/30/2025
- File Size 0.3MB
- # of Slides 2
- File Format PPTX
- Slide Ratio 16:9
- Color
Keywords
About the Product
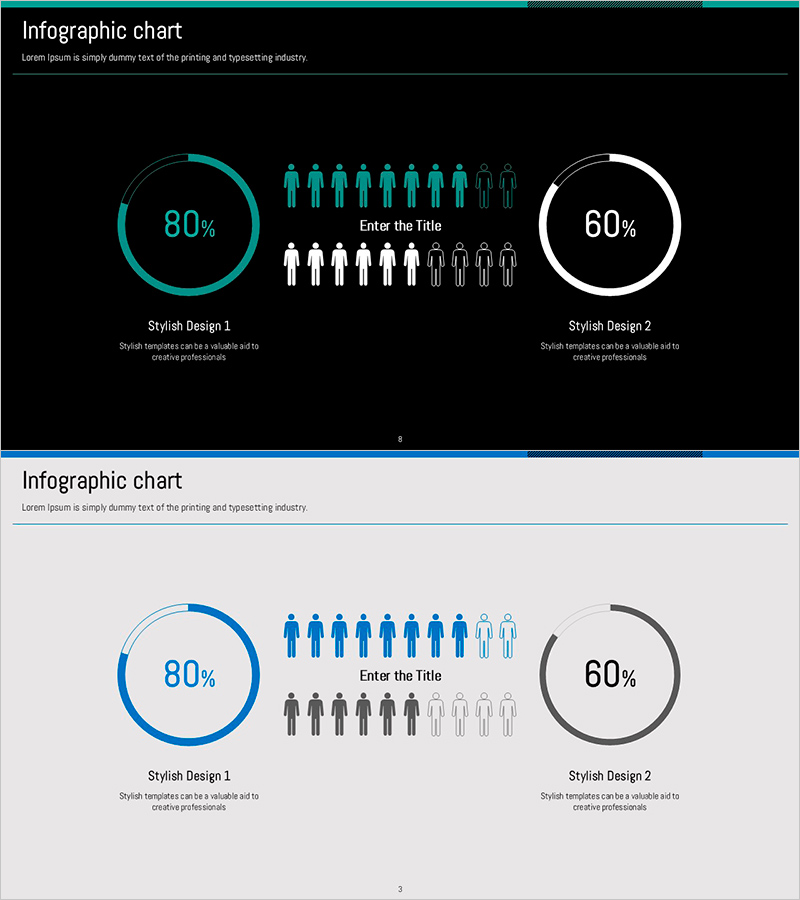
A dual donut chart PowerPoint slide designed to visualize customer share and market analysis with two distinct design styles. The template features a turquoise and white color scheme, with each slide displaying a left donut chart (80% representation) and a right donut chart (60% representation), separated by centered human icons showing gender or customer segment distribution. Delivered in 16:9 widescreen format with 2 slides, this presentation resource is ready for immediate use in competitive analysis, customer segmentation, and market share presentations.
Usage Points
-
Main Usage
Visualize customer share, market share, and competitive analysis using two donut charts simultaneously. The centered human icons represent gender distribution, customer segments, or market categories, enabling intuitive presentation of dual-axis data structures and comparative metrics.
-
How to Use
Apply this template in business presentations, marketing strategy documents, market analysis reports, and customer segmentation materials when comparing two categories of proportional data. Edit the donut chart percentages and labels with your actual data, and adjust colors to align with corporate branding guidelines.
-
Recommended For
Marketing professionals, sales strategy teams, business executives, market research analysts, and customer relationship management (CRM) specialists who need to communicate customer segmentation, market share distribution, and competitive positioning data effectively.
-
Slide Structure
2-slide set. Each slide features a left donut chart (turquoise or blue gradient, 80% display), centered human icons (10 figures representing gender or segment split), a right donut chart (white or gray gradient, 60% display), and descriptive text labels ('Stylish Design 1' and 'Stylish Design 2') at the bottom.
Related Products
-

Market Share Donut Pie Chart & Silhouette – Unique Design and Information Delivery
#Market and Competitor Analysis #Graph #Other
-

Customer Analysis Donut Chart - Visualizing Market Share
#Market and Competitor Analysis #Graph #Other
-

Customer Analysis and Market Share Graph – Harmony of Blue and Red
#Market and Competitor Analysis #Graph #Other
-

Key Customer Segmentation Analysis Donut Chart
#Market and Competitor Analysis #Graph #Customer Analysis
