Travel Business Competitor Analysis and Market Share – Doughnut Chart Based
RJ0600035_5
- Last Update 06/30/2025
- File Size 0.5MB
- # of Slides 2
- File Format PPTX
- Slide Ratio 16:9
- Color
Keywords
About the Product
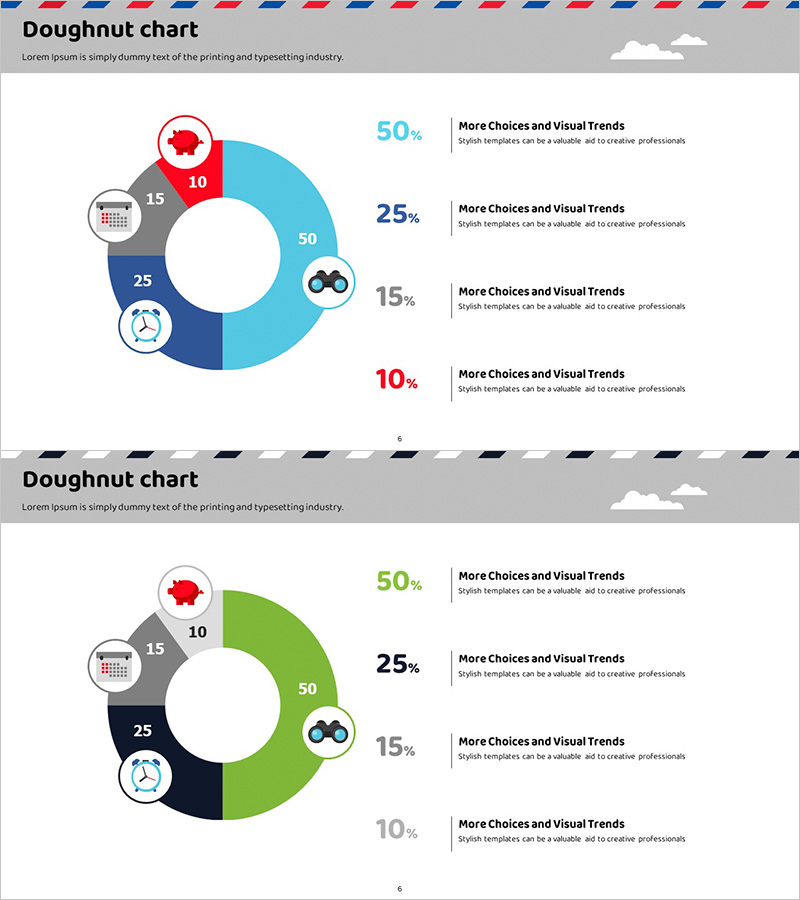
A PowerPoint slide featuring a 4-segment doughnut chart designed to visualize competitor analysis and market share in the travel business. The chart uses four distinct colors—blue, red, gray, and green—to represent segments of 50%, 25%, 15%, and 10% respectively, with a central circular space for key metrics. Each segment includes an icon (map, calendar, binoculars, clock) to convey category meaning intuitively. This 2-slide PPTX presentation in 16:9 format is fully editable and ideal for travel, tourism, accommodation, and airline industry presentations.
Usage Points
-
Main Usage
Designed to compare and analyze four data categories in the travel industry—market share, competitor positioning, customer distribution, and revenue composition—at a glance. The doughnut structure leverages the central space to emphasize key metrics or totals, making data interpretation immediate and intuitive.
-
How to Use
Replace each segment's color and percentage values with your own data, and swap icons for category labels. Add descriptive text in the right panel such as 'More Choices and Visual Trends' to enhance audience comprehension. Use both slides to present multiple data combinations or comparative analyses.
-
Recommended For
Ideal for travel agencies, airlines, hotels, and tourism boards. Marketing professionals, sales teams, and executives can use this template for market analysis presentations, business reports, investor pitches, and strategic planning meetings. Particularly effective for explaining competitive landscape, customer segmentation, and revenue breakdown.
-
Slide Structure
Both slides feature identical layout: central doughnut chart with 4 segments (50%, 25%, 15%, 10%) and circular icons on each segment. Chart positioned left, with percentage values and descriptive text area on the right. Header area for title, footer for page numbers. 16:9 widescreen format.
Related Products
-

Bottled Beer Donut Chart – Market Share Visualization
#Market and Competitor Analysis #Marketing Plan and Strategy #Graph
-

Soccer Match Analysis Chart – Performance Analysis and Future Forecast
#Business Vision and Strategy #Market and Competitor Analysis #Graph
-

Market Share Donut Chart for Eco-Friendly Businesses – Trends and Insights
#Market and Competitor Analysis #Graph #Market Share
-

Visualizing Market Share with Watercolor Donut Chart
#Market and Competitor Analysis #Graph #Market Share
