Halloween Share Chart – Market Analysis and Visual Communication
RJ0600039_29
- Last Update 08/28/2025
- File Size 2.7MB
- # of Slides 2
- File Format PPTX
- Slide Ratio 16:9
- Color
Keywords
About the Product
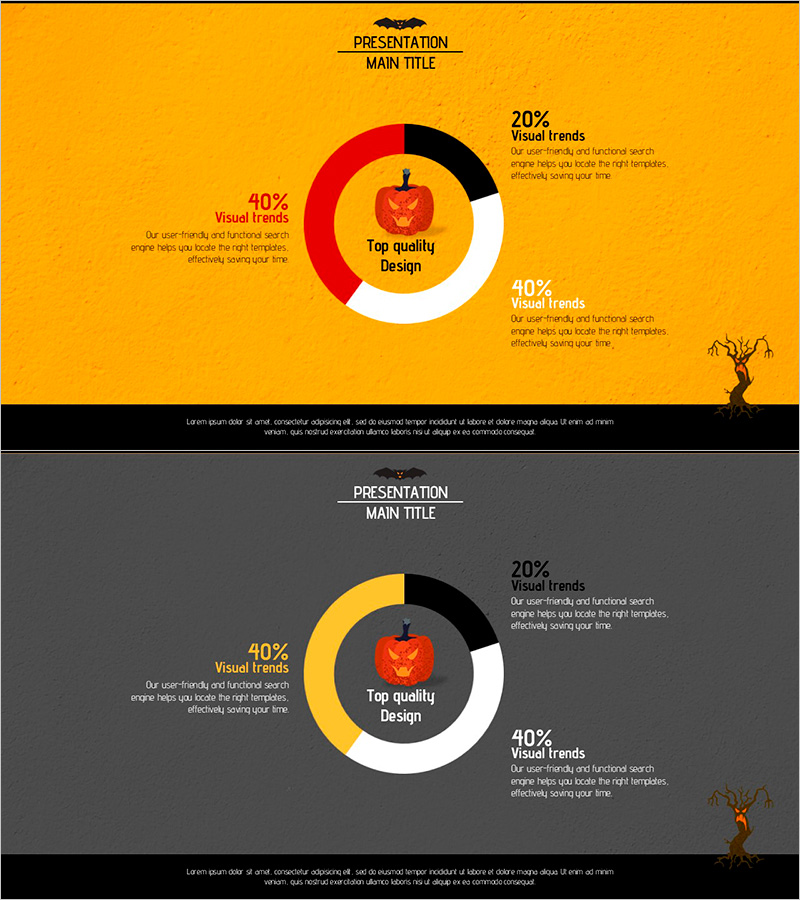
A 4-segment donut chart PowerPoint slide with Halloween theme for visualizing market share, sales ratio, customer distribution, and budget allocation. The design features orange, red, black, and white color segments with a pumpkin icon and text area in the center to highlight key messages. Left and right text boxes provide detailed information for each segment. The 2-slide set includes both yellow and gray background versions to suit different presentation contexts. Fully editable PPTX format allows you to customize percentages, labels, and descriptions instantly.
Usage Points
-
Main Usage
Display and compare four data segments representing market share, sales ratio, customer distribution, or budget allocation at a glance. The donut chart's center area emphasizes key messages, while left and right text boxes provide detailed explanations for each segment, making complex data easy to understand.
-
How to Use
Use in business presentations for market analysis, sales performance, and customer segmentation sections. Ideal for Halloween season marketing campaigns, retail sales analysis, event planning pitches, and quarterly performance reviews. The yellow background conveys energy and vibrancy, while the gray version projects professionalism and authority.
-
Recommended For
Marketing managers, sales directors, data analysts, and executives preparing performance reports benefit from this template. Recommended for retail, distribution, event planning, and marketing departments presenting quarterly results, market research findings, and budget allocation plans.
-
Slide Structure
The donut chart is divided into 4 segments with proportions of 40%, 20%, 40%, and 20%. A pumpkin icon and 'Top quality Design' text occupy the center. Percentage values and descriptive text boxes are positioned on the left, right, top, and bottom. Both slides maintain identical chart structure with only background color variation.
Related Products
-

Logistics Donut Chart – Performance and Market Shares
#Business Strategy #Market and Competitor Analysis #Diagram
-

Recent Market Status Slide with Donut Chart
#Market and Competitor Analysis #Graph #Market Status
-

Travel Business Competitor Analysis and Market Share – Doughnut Chart Based
#Market and Competitor Analysis #Graph #Market Share
-

Equipment Demand Configuration Graph – Effective Visualization for Market Analysis
#Market and Competitor Analysis #Diagram #Graph
