Future Travel Competitor Market Forecast Blue Green
RJ0600035_17
- Last Update 06/30/2025
- File Size 0.4MB
- # of Slides 2
- File Format PPTX
- Slide Ratio 16:9
- Color
Keywords
About the Product
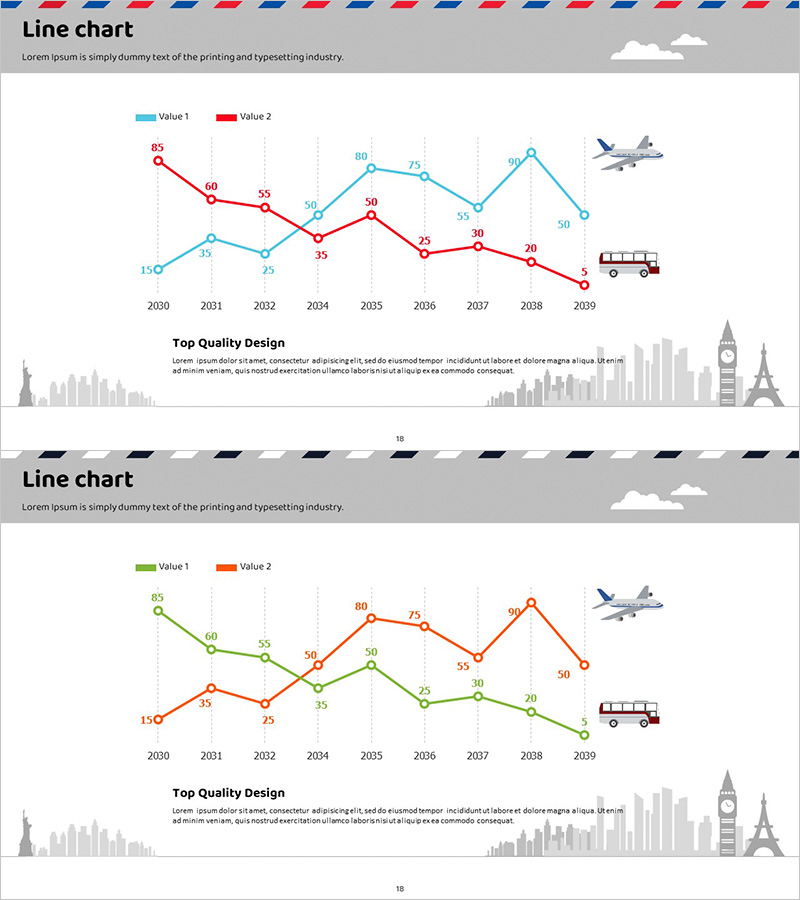
A dual-series line chart PowerPoint slide designed for travel industry market forecasting and competitive analysis. This presentation template visualizes 10-year data trends from 2030 to 2039 using two distinct lines to compare competitive performance side by side. The contrasting blue and red color scheme clearly differentiates each data series, while grid background and labeled data points enable precise numerical interpretation. Ideal for market analysis presentations, competitive benchmarking reports, and industry outlook discussions in travel, tourism, aviation, and transportation sectors. Fully editable and ready for immediate use in business decks.
Usage Points
-
Main Usage
Compares market forecasts and competitive performance in travel, tourism, aviation, and transportation industries over time. The two-line graph clearly illustrates competitive trends, including rising, declining, and intersection points, providing strategic insights and decision-making evidence.
-
How to Use
Insert into business plans, investor pitch decks, market analysis reports, and executive briefings. Simply edit the data points and legend with your actual figures to create a ready-to-present slide. The grid background aids numerical readability, while industry icons (airplane, bus) reinforce sector context.
-
Recommended For
Executives, marketing managers, strategic planning teams, and investor relations professionals in travel, tourism, aviation, transportation, and logistics industries. Particularly effective when presenting quantitative market data and competitive positioning to stakeholders.
-
Slide Structure
Two slides with identical structure. Each slide features a dual-series line chart (blue and red), X-axis spanning 2030-2039, Y-axis ranging 0-85, ten data points per series, legend box, title area, and descriptive text section at bottom. Color variations allow selection based on presentation preference.
Related Products
-

Social Network Market Competitor Analysis PPT – Data Driven Competitive Advantage
#Market and Competitor Analysis #Diagram #Graph
-

Comparative Analysis Line Graph – Highlighting Competitive Advantage
#Market and Competitor Analysis #Graph #Competitor Analysis
-

Competitor Comparison Broken Line Highlight Graph
#Market and Competitor Analysis #Graph #Competitor Analysis
-

Competitive Advantage Broken Line Graph – Market and Competition Analysis
#Market and Competitor Analysis #Graph #Competitor Analysis
