Travel Market Future Outlook Analysis Chart – Drawing Future Opportunities
RJ0600035_14
- Last Update 06/30/2025
- File Size 0.4MB
- # of Slides 2
- File Format PPTX
- Slide Ratio 16:9
- Color
Keywords
- #Content-Based Slides
- #Design-Based Slides
- #Technical Approach
- #Market and Competitor Analysis
- #Graph
- #Future Development Roadmap
- #Future Outlook
- #Column
- #Column Chart
- #16:9
- #travel market chart
- #vertical bar chart PowerPoint
- #market analysis presentation slide
- #growth trend graph
- #travel industry data visualization
- #business chart template
About the Product
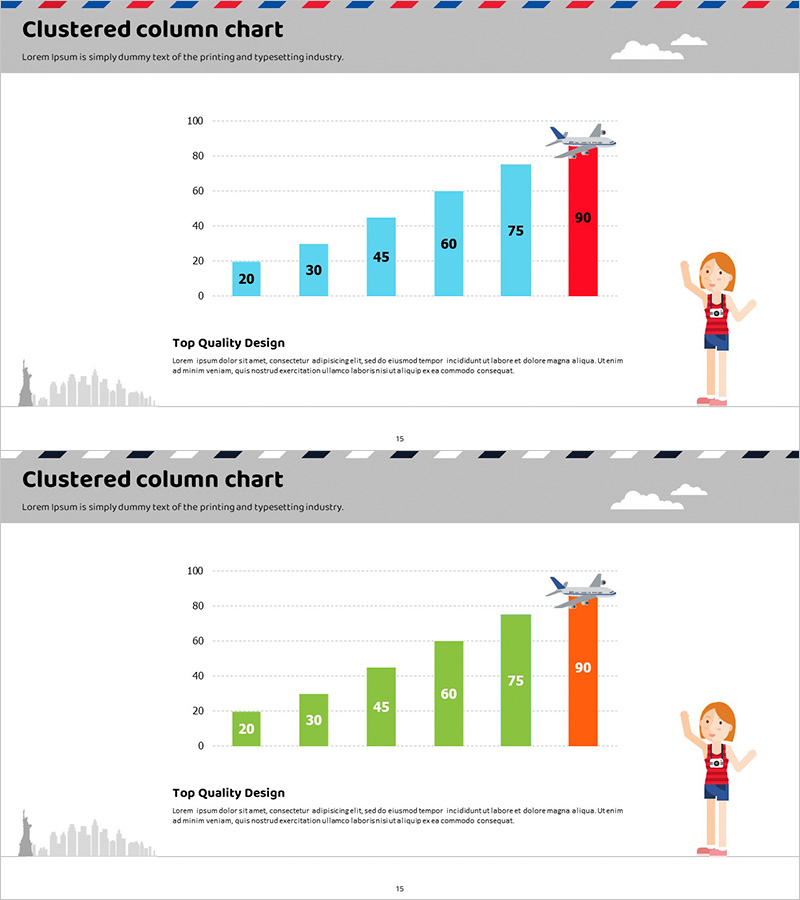
A vertical bar chart PowerPoint slide visualizing the travel industry market size progression across 8 stages with values from 20 to 90. The gradient color scheme transitions from light blue to deep red, emphasizing the growth trajectory at each step. This slide deck is ideal for travel market outlook presentations, market analysis reports, and business forecasts. The design incorporates airplane and traveler illustrations with a city skyline background to reinforce the travel theme. Optimized for 16:9 widescreen format in a 2-slide set, making it ready for immediate use in investor pitches and strategic planning sessions.
Usage Points
-
Main Usage
Effectively communicates travel industry market size changes, growth rates, and future outlook through data-driven visualization. The vertical bar chart's ascending heights intuitively represent growth progression, while the gradient color scheme visually reinforces temporal change and market momentum.
-
How to Use
Deploy in travel agencies, tourism board presentations, travel platform company reports, investor briefings, and market analysis sessions. Easily customize bar values to reflect actual market statistics and regional data. The background illustrations maintain visual consistency with travel industry branding and messaging.
-
Recommended For
Travel agency marketing teams, tourism board policy makers, travel platform product managers, market research consultants, and business development professionals presenting market size and growth potential to stakeholders.
-
Slide Structure
Two-slide set featuring a centered vertical bar chart with 8 bars (values 20–90) on each slide. Left side displays a city skyline silhouette background; right side shows airplane and traveler character illustrations. Gradient coloring from light blue (initial values) to deep red (peak values) clearly indicates growth direction and market progression.
Related Products
-

Rise and Fall Vertical Bar Graph – Essential for Market Analysis
#Market and Competitor Analysis #Graph #Future Outlook
-

Exercise Ability Improvement Graph
#Business Strategy #Market and Competitor Analysis #Graph
-

Analysis and Graphs in Future Prediction – Market Strategy and Profitability
#Business Strategy #Market and Competitor Analysis #Diagram
-

Orange & Green Future Outlook Bar Graph
#Business Strategy #Market and Competitor Analysis #Graph
