Market Trend Analysis of Eco Farming Data Visualization
RJ0600033_7
- Last Update 06/30/2025
- File Size 1.4MB
- # of Slides 2
- File Format PPTX
- Slide Ratio 16:9
- Color
Keywords
About the Product
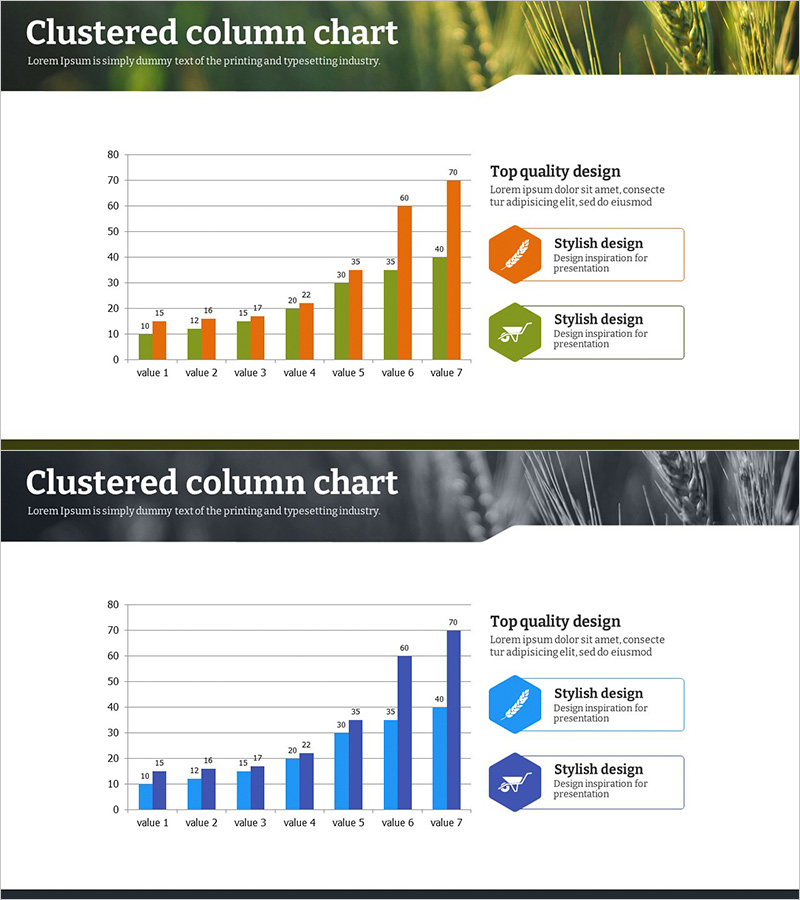
A 2-slide clustered column chart PowerPoint template for eco-farming market trend analysis and data visualization. The slides feature grouped bar charts with three data series (orange, blue, and green) comparing seven values across different categories. Each slide includes a full-width background image (grain and water themes) with explanatory text and icons positioned on the right side for enhanced information delivery. Provided in 16:9 widescreen PPTX format, fully editable and ready for agricultural, environmental, and market analysis presentations.
Usage Points
-
Main Usage
Visualize multi-series numerical data such as market trends, sales performance, and key metrics across multiple categories. The clustered structure allows side-by-side comparison of different data series within each category, making comparative analysis clear and intuitive. Ideal for sustainability, agricultural policy, and environmental impact presentations.
-
How to Use
Replace the bar lengths and numerical values with your own data. Use the three color series (orange, blue, green) to distinguish between categories, time periods, or data types. Edit the right-side text boxes to add analysis insights and conclusions. Background images can be customized to match your presentation theme.
-
Recommended For
Agricultural and environmental organizations, market research reports, sustainability initiatives, policy proposals, academic seminars, and investor presentations. Recommended for marketing, planning, analytics, and research professionals who need to communicate data-driven insights visually.
-
Slide Structure
2-slide set. Each slide features a full-width background image (grain or water theme), a clustered column chart with 7 categories and 3 data series in the center, and an explanation area on the right with 2 icons and 2 text boxes. 16:9 widescreen format, PPTX file.
Related Products
-

Blue Orange Growing Bar Graph – Performance and Competitive Edge
#Business Strategy #Market and Competitor Analysis #Graph
-

3D Stacked Bar Breakdown - Market and Competitor Analysis
#Market and Competitor Analysis #Graph #Industry Trends
-

Blue Purple Bundled Chart – Optimized for Market Analysis
#Market and Competitor Analysis #Graph #Competitive Advantage
-

Construction Equipment Usage Graph
#Market and Competitor Analysis #Graph #Competitive Advantage
