Pie Chart of Market Share Analysis with Agricultural Competitors
RJ0600033_26
- Last Update 06/29/2025
- File Size 1.4MB
- # of Slides 2
- File Format PPTX
- Slide Ratio 16:9
- Color
Keywords
About the Product
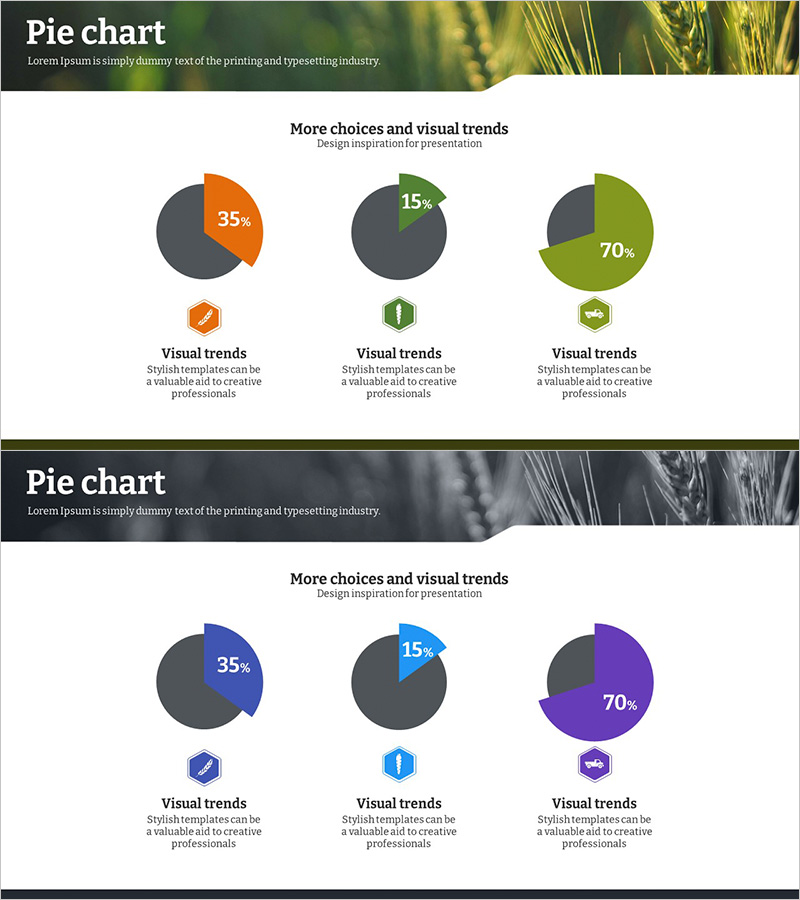
A pie chart PowerPoint slide that visualizes competitive market share in the agricultural industry. The design features a dark gray background with clear color contrasts in orange, green, and blue to represent three data segments, with percentage values displayed directly on each slice. The 2-slide set offers multiple color combinations (orange, green, blue, and purple) for flexible adaptation to different presentation contexts and brand guidelines. This data visualization slide is ready to use for competitive analysis presentations, market share comparisons, industry trend reports, and business strategy meetings.
Usage Points
-
Main Usage
Visualize competitive market share comparison, analyze industry market structure, and present market positioning data. The 3-segment pie chart enables quick comprehension of market distribution, making it ideal for executive reports, investor presentations, and marketing strategy briefings.
-
How to Use
Double-click each pie segment to edit percentage values and labels. Change colors via the Shape Format fill option. Replace icons using the Insert tab. Select your preferred color combination from the 2-slide set and customize data as needed.
-
Recommended For
Executives, marketing managers, and business planning teams in agriculture, food, and distribution industries. Recommended for competitive analysis reports, quarterly market status presentations, investor briefings, and industry analysis documentation.
-
Slide Structure
2-slide set. Each slide contains one 3-segment pie chart with three icons below. Slide 1 features orange, green, and dark gray; Slide 2 offers blue, purple, and dark gray color variations. Optimized for 16:9 widescreen format.
Related Products
-

Development Status Pie Chart – Visualizing Market Share
#Product/Service Introduction #Market and Competitor Analysis #Graph
-

Pie Chart of the Development Status of the Snow Mountain Theme
#Product/Service Introduction #Market and Competitor Analysis #Diagram
-

Carbon Neutral Customer Survey Pie Chart
#Market and Competitor Analysis #Graph #Market Status
-

Brand Awareness Distribution Chart – Market Share Analysis
#Product/Service Introduction #Market and Competitor Analysis #Graph
