Aurora Camping Business Global Map Analysis
RJ0600032_32
- Last Update 06/29/2025
- File Size 1.2MB
- # of Slides 2
- File Format PPTX
- Slide Ratio 16:9
- Color
Keywords
About the Product
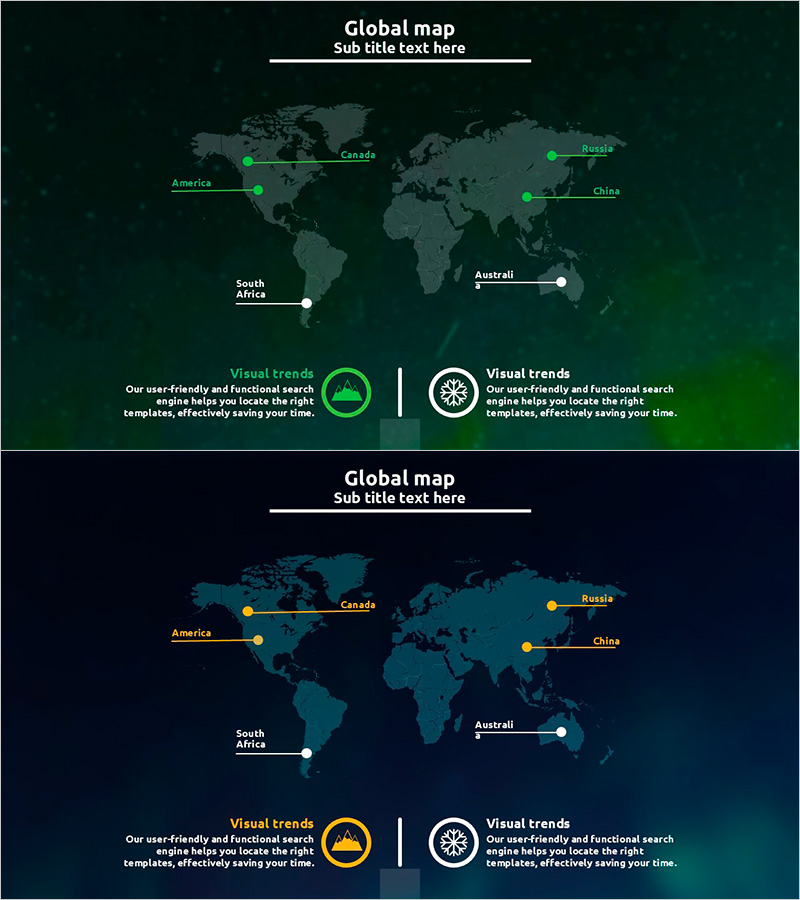
An essential PowerPoint slide for presenting international market expansion strategies with a global map visualization. This slide features a dark green background with a world map and six key countries—Canada, Russia, China, USA, Australia, and South Africa—marked with green location indicators. Each country is labeled with a connecting line, and the left side includes a 'Visual trends' section for adding market insights and analysis commentary. The 2-slide PPTX deck in 16:9 format is fully editable and ready to use in presentations for camping businesses, manufacturing, retail, and other global expansion initiatives.
Usage Points
-
Main Usage
Designed to visually communicate global business presence and international market positioning during strategy presentations. The world map with country markers effectively illustrates international business networks, global supply chains, overseas branch locations, and market penetration across multiple regions.
-
How to Use
Use this slide in investor pitches, executive briefings, and strategic planning meetings as the market analysis section. Click on each country marker to link to detailed regional market data, competitive landscape, or entry strategy slides. Customize the left 'Visual trends' text areas with key metrics, market size, growth rates, or strategic priorities relevant to your presentation.
-
Recommended For
Ideal for executives planning global expansion, international business development managers, investor relations professionals, and overseas sales teams. Applicable across industries including camping and outdoor recreation, manufacturing, retail distribution, IT services, and any business pursuing multi-country market entry.
-
Slide Structure
Two-slide layout with consistent design. Slide 1 features a dark green background with world map, 6 green location markers with country labels, and two text sections in the 'Visual trends' area on the left. Slide 2 uses a dark navy background with the same map structure but orange location markers, enabling comparative analysis or timeline-based market evolution visualization.
Related Products
-

Camping Market Trend Survey Line Graph – Trend Displayed in Orange and Yellow
#Market and Competitor Analysis #Graph #Other
-

Gender Ratio Analysis of Coffee Consumers - Consumption Patterns of Men and Women
#Market and Competitor Analysis #Graph #Other
-

Global Map Camping Market Analysis by Country – Market Status and Opportunities
#Market and Competitor Analysis #Other #Market Analysis
-

Pie Chart of Camping Business Market Share by European Country
#Market and Competitor Analysis #Graph #Other
